Monday, February 28, 2011

WEEKLY TECHNI VIEW 280211


Technical view for the week ended 25/02/2011:
It was a tough week for traders and analysts both in terms of volatility prior to the budget and because of the settlement.
We had suggested as some strength was developing on daily chart looking at the possibility of the INVERTED HEAD AND SHOULDER structure but luckily we clearly mentioned that any upside possibility for nifty was only on a close above 5527 and for sensex that crucial level was 18457 but both index failed to close above these levels even though bulls tried for two days to cross them.
And finally on Thursday as there was a hint of weakness as we suggested that the 5/8/13 ema band has again given a sell cross and so on the settlement day  as sensex started to trade below 18050 and nifty below 5369 it was clear that the bullish pattern was not going to work.
We suggested through last 2/3 weeks technical views that the bse health index  bse it index and bse auto index have formed major tops and this analysis worked last week as the banking index bounced back but these other indices let sensex and nifty down and because of weakness in these indices the supposed INVERTED HEAD AND SHOULDER pattern did not work.
Last week we also suggested about extreme overbought condition of dow jones and the us markets fell the most in last 3 months during last week.
We did clearly mentioned a few points in last few days one was that the correction must remain slow second was that if the positive structure has to work sensex must close above 18457 which was Tuesdays high third was protection of 18050 fourth was extreme high overbought position of dow jones and  as sensex started to trade below 18050 it was clear that the supposed head and structure is not going to work and as we said in our weekly technical view if such positive structures fails it can have severe downside impact.
Any rise from now on will be short lived and will have to be used to create short positions only.

What can we expect in the budget week ?
First a big caution for traders this week that the sensex and nifty are at supports as they are near their February lows and Monday will be budget day and markets will be very very volatile for two days as on the budget day there will be intraday volatility on finance ministers announcements and on the next day  there will be some gap up and gap down moves in different stocks and sectors as the market understands the positives and negatives from budget for them.
Sensex :
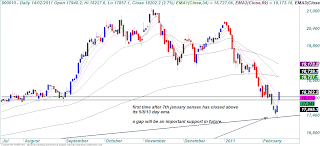
Sensex made a HAMMER on daily chart on Friday but it need a big bull candle as a follow up to confirm a short term bottom and although there can be a double bottom pattern on daily chart looking at the price structure pn weekly chart there is more possibility of a few days sideways move if 17400 is held..
For today support at 17470 and 17339 and resistance at 17812 and 17940 all bullish possibilities are valid only after sensex closes above 17940.
For the whole week 18086 and 18032 are levels to watch for the upside and to be considered as strong resistance levels for the week.
On the downside 17400 is the level to watch for this week.we are presenting sensex charts of different time frames with comments for medium term.


Friday, February 25, 2011

INDIAN MARKETS IN A FIRM BEAR GRIP


Sensex : the sensex breached 18050 and that was all.
We did clearly mentioned a few points in last few days one was that the correction must remain slow second was that if the positive structure has to work sensex must close above 18457 which was Tuesdays high third was protection of 18050 fourth was extreme high overbought position of dow jones and  as sensex started to trade below 18050 it was clear that the supposed head and structure is not going to work and as we said in our weekly technical view if such positive structures fails it can have severe downside impact.
Any rise from now on will be short lived and will have to be used to create short positions only.
Sensex has strong resistance at 17927- 18050-18081-18370 some support at 17519 and 17295 but in coming days we should see 16372 coming as a first target and a halt.
NIFTY: nifty was unable to cross 5527 although in last two days it tried to touch 5500 but there was some selling pressure seen at that level that is precisely why we said on nifty chart yesterday that theoretically the price structure looks like a head and shoulder but it must cross the neckline and correction which would have been a right shoulder must remain slow which was not to be and once below 5408 even 5369 did not work as a support.
For today strong resistance at 5337-5369-5408 any rally should be used to short nifty and stocks as we can have positional nifty target at 5083 and 4945 in coming days.

Monday, February 21, 2011

WEEKLY TECHNI VIEW


General technical review for the week ended 18/02/2011 :
i said this when we presented our weekly technical review on 14/02/2011 “
 Although there is no significant candle pattern on weekly chart as on last week which can suddenly reverse the ongoing crash we feel that SENSEX has hit a short term bottom just as a halt to the huge crash that we have seen recently. SENSEX need to close above 18038 to extend the corrective rally further up to 18600+ in a few weeks time.”
And indeed when sensex crossed and closed above 18038 it touched 18691 on Friday and since we also clearly suggested that this 18600+ area for sensex and 5580 around level for nifty has plenty of resistances including  34 day ema so sensex and nifty both met with initial targets and touched 34 day ema and retraced back significantly.
So in a span of just two weeks our targets on the downside were achieved our supports worked and even our targets reached on the up side and resistance levels has also worked remarkably well.

WHAT  NEXT  ?
SENSEX:  sensex found a multiple resistance zone in 34/200 day ema  and Fibonacci retracement level and also the momentum indicator stochastic has turned down from overbought zone so sensex went down by 295 points on Friday and on daily chart there is a candle reversal pattern called DARK CLOUD COVER so preferably the five day rally has ended at Fridays high of 18691.
But looking at the price structure which is a very good “ V “ shape reversal we can expect a RIGHT SHOULDER of the inverted head&shoulder pattern developing if the down side started from Friday looses its momentum and stops above the gapped area and between 17927 and 18050 in the coming week and bounces back.
So watch these support levels in a few days and any upside candle reversal pattern if develops.
Here is the weekly chart of sensex with our comments on it.


Nifty:
For nifty this week 5408-5369 is the most important zone to watch if the supposed inverted HEAD AND SHOULDER pattern has to work.
So in few days if nifty comes down around 5350 and closes back above 5369-5408 completing a solid upside candle reversal pattern there will be higher probabilities of such pattern to work but theoretically the pattern can meet upside targets if and after nifty closes above the neckline drawn on nifty chart which is around 5625.
Also watch fast stochastic movement in first few days of the week as it has turned down and will enter oversold zone by Thursday if the downtrend continues.
If the downtrend started on Friday continues and the pattern does not complete then such failure can have very severe price damage.

Friday, February 18, 2011

tech view for 18/02/2011


Sensex: crossing Tuesdays high was a technical level booster move for sensex and then there was never stopping for sensex for yesterday and it has been able to closes at the days high suggests that a correction if comes will be a good buying opportunity for a few days.
Readers must remember that even in a medium term downtrend we had projected higher sensex almost exactly at the bottom day when we said in our last weekly technical view that the 89 week ema for sensex will be a very good support level and that is what has happened through out the current week.
Sensex should reach 18583 first and should correct from there and after looking the shape and structure of the correction if we get a buying entry again sensex may resume upward movement where in it will have another target of 18980.


Nifty: for nifty our support level was 5450  and we said that once nifty crosses 5507 it will reach 5565 and today itself nifty high was around 5550 once 5507 was crossed.
On the Monday morning after just one days upmove we predicted 5564-5625 in our weekly technical view for nifty as we found a bullish falling wedge structure on eod charts of nifty and in just four working days nifty touched 5553 yesterday.
There is a very good strength in this rally but it will soon start facing selling pressure around 5583-5614 level and now it has strong support at 5507 level.


Tuesday, February 15, 2011

tech view 150211


Sensex:
Sensex opened with a huge gap and yesterdays opening gap is going to become an important support  for the future.
We said that sensex need to cross 18038 for confirmation of strength of rally and it did not only crossed 18038 but close very strongly above it now sensex will find resistance at the upper end of the channel and may pass on a few days in a lackluster and sideways move.
For today  18287 will be the level to watch as a resistance and on the downside for 2-3 days 17894 will be an important support level to watch where one can initiate fresh long position for short term.

Nifty :
We said very clearly that nifty need to cross and close 5339-5369 for the confirmation of an upmove and at the open itself first level was clearly crossed and nifty bounce back with good volumes.
5470 will be a level to watch where nifty will face some resistance but if nifty passes on 1-2 days around 5400 then nifty will cross this level and march on to our first target around 5537-5554 and we expect some selling there before nifty moves up again.


Monday, February 14, 2011

A MIRACLE ON FIVE MINUTE CHARTS

i had picked the recent bottom in time as i had given strong supports around 17625 and 5212 for sensex and nifty and in addition the lower end of channel and 89 week ema for both sensex and nifty were shown as very very clear and strong supports.

just look how my trading system works for nifty intraday charts.


Sunday, February 13, 2011

WEEKLY TECHNI VIEW


General technical review of what happened last week:
The bearishness continued till the last day of the week.
We suggested in our technical view for the last week on 07/02/2011 and during the week through our daily technical view that there is a chance of a bounce back from supports around 17625-17065 for sensex and from 5212-5169 around for nifty and as shown on charts presented with our daily technical view these area was multiple support zone one being the 89 week ema and the other lower end of the year long channel.
And this is exactly how the supports worked on Friday.

How will be the week ahead ?
Sensex:
Although there is no significant candle pattern on weekly chart as on last week which can suddenly reverse the ongoing crash we feel that sensex has hit a short term bottom just as a halt to the huge crash that we have seen recently.
Sensex need to close above 18038 to extend the corrective rally further upto 18600+ in a few weeks time.
A few clarifications, one is that we FIRMLY believe that the supposed rally will be corrective in nature only and second is that the rally will unfold in three waves two up and one down and very highly bitten down create short positions in sectors which looks to start fresh breakdown like metals and few pharma stocks
Nifty :
For nifty it needs to close above 5339-5369 for confirmation of a short term bottom.
And as explained on the charts here it looks like a falling wedge structure on nifty chart and it has upside targets of around 5564-5625 in a few weeks time.


Wednesday, February 9, 2011

tech view 090211


Sensex :
Another downside target in sensex reached with some terrific bear onslaught.we have been quite consistant in saying that technicals are always ahead of fundamental and technicals suggested a major top way back in mid October 2010 at that time there was no indication of any fundamental weakness. Now as the markets have been in a strong bear grip analysts are talking about higher crude prices and higher inflation and the stronger possibility of further hikes in interest rates.
Watch 17625 and 17065 for sensex for some kind of a halt.
But strong resistance at 18180-18235-18542 for a few days strong downside momentum is confirmed with very high value of adx on daily chart.

Nifty:
Once 5373 was broken nifty straight away tanked to 5337 nifty tried to bounce back by an intraday up swing of 30+ points  but again that was only a short time halt and nifty closed at 5312.
Now 5268 is possible and even 5212 is perhaps due which is the value of 89 week ema for nifty as on today.
Any upmove is possible once if nifty closes above 5416-5445 but very strong upside correction only after nifty closes above 5527.
Just a reminder to our readers that we had clearly advised everyone to exit longs in our annual meet in early January and small cap and mid cap index are down by 15% since then.

Monday, February 7, 2011

WEEKLY TECHNI VIEW


General technical view:
If we have to describe the week gone by in a nutshell we can say “ the weakness is now being converted from smaller timeframe charts to larger one”.
We use candle patterns in analyzing markets as a one of the most important tools initially candle reversal patterns started to appear on daily charts then from the month of November-2010 there were candle reversal patterns on weekly charts but some how reversal patterns were not got completed on monthly charts even after huge sell off in the month of November in sensex-nifty but we used our observation of double candle reversal patterns and in january-2011 we have second reversal patterns on monthly charts and as described in details in the last weekly technical view now the reversal patterns have started to appear on quarterly charts.

And more importantly now as the bears are in full control of markets the positive bullish candlestic reversal patterns has simply stopped working in favour of bulls.
On  3rd jan,Thursday morning in our daily technical view we said that there will be a good chance of a short term upside rally if nifty closes above 5527 we said this because we had a few technical evidences that markets may produce an upside rally one was the oversold condition of stochastics on daily and weekly charts and the other was that nifty was some how holding 5416 which was our level mentioned in weekly tech report of 24th January .
Nifty completed a morning star pattern on daily chart on 3rd jan but closed at 5526.75 .
So not closing above 5527 and then could not sustain above 5527 on 4th jan and so the morning star pattern did not work.

We believe that we will have to have two candle stick reversal patterns on daily charts and then we may expect a relief rally and that too if 5337-5268 works as support in the coming week.
It can be painful to die hard bulls or long term investors to see such a massive erosion of the valuations of ones portfolio in a span of just three-four months but we would like to reproduce  few lines of our technical view dated 11th October 2010 as we believe that  now when nifty has closed at 5395 from a high of 6335 in the first week of November 2010 the job of doing technical analysis and identifying major turning point has been done in the most satisfactory manner on our side.
 first week of November will be an 89TH WEEK of the entire rally started  from march -2009. 89 being a fibonacci no. it will be an important juncture in doing time analysis.”
“Fibo. Retracements is an all important  technical tool used to find out supports /resistance levels.if we assume that looking at the present mood of the markets and money flow from the FIIS, IT IS ENTIRELY POSSIBLE THAT we may see 21200 level of sensex in coming days “
So ,concluding this article ,we can presume that one important top is nearby.Tracking the possible top and confirming it using other technical tools, will be a job ahead.”
WHAT CAN BE THE FUTURE COURSE OF MARKETS ??
We had predicted 14000-15000 sensex target for the year 2011 in early January in our annual meet.
We firmly believe that our markets are heading towards those levels in 2011 and as we all can understand that such bigger targets can not be reached in a hurry so there will be some corrective which should be termed as bear market rallies but we will come out with further targets for sensex and nifty.
Since last 4-5 months in our daily and weekly technical reviews we have extensively used candlestick patterns and  exponential moving averages to identify all up and down moves of both indices so it will prudent to look at the ema band on weekly charts as now after the massive 3000+ points crash in about three months time now even on weekly charts the 5/8/13 ema band has given a DEAD CROSS below 34 week ema.
And the sensex has for the first time closed below 34 week ema after march 2009 .
In may 2010 sensex closed below this 34 week ema for one week only and bounced back so three consecutive close below it now confirmas our bearish view for medium term as the ema band sell cross is getting converted from daily charts to weekly charts

.