Tuesday, June 26, 2012

TECH VIEW


SENSEX: SENSEX made a HIGH of 17138 and crashed from their as you all know I had suggested 17120 as THE LEVEL to watch for SENSEX to enter a BULL ZONE
My preference has been a CLOSE above 17120.
As suggested earlier this little phase of last 12 trading days has been difficult for positional traders but from today onwards we would see a clear TREND in either direction.
Today if SENSEX sustains below 18800 it will reach 16636 and a close below 16636 would be considered as a BREAK DOWN from the range.

NIFTY: future NIFTY again was a leader yesterday as it TOUCHED 5203 which was the first level of resistance zone of 5203-5217.
5093 is the level to watch first and then 5041.
A close below 5041 will be dangerous for BULLS and as shown on the NIFTY CHART the recent corrective phase looks like a DIAMOND CHART PATTERN and a break below 5041 will initiate a fresh down move.
4931 is the 61.8% retracement so that could be the TREND DECIDER level for the month of JULY 2012.

Friday, June 22, 2012

SYSTEM : BETTER IF NIFTY BECOMES MORE VOLATILE

CHART SPEAKS:
NIFTY 5000 CE


AGAIN@RESISTANCE


SENSEX: this has been another good attempt from bulls to CLOSE SENSEX above 17120
If this happens by Friday it will be very good indeed.
There is better thing in yesterdays up move that there was very good participation from most of the leading stocks
SENSEX closed at 17050 which in the middle of my STRONG RESISTANCE ZONE of 16920-17120 as I have been insisting of a weekly close above 17120, it will be crucial if our markets can attain these levels even after a GAP DOWN open today.
A close below 16840 and 16636 today will again put pressure on bulls.


NIFTY: once again initial hurdle at 5133 and 5156 has been crossed but as I have been insisting for a WEEKLY CLOSE above 5217 it will be critical to watch NIFTY CLOSE today
DJIA has been down overnight and a GAP DOWN close will be possible so watch 5100 and 5041 levels for today as support and be careful in longs if NIFTY CLOSES below 5100-5041 today.
Do remember that UNLESS ADX picks up one should not expect big move on either side.
In case of NIFTY closing below 5041 it could become a case where one can short rallies in coming days.


Wednesday, June 20, 2012

TRADING SYSTEM ON NG


DIRECTIONLESS AGAIN


BOTH SENSEX AND NIFTY did reach their respective targets/resistance and now we are watching a TOUGH FIGHT between bulls and bears AT A CROSS ROAD

at present one can not have a PREDICTION as such but can have LEVELS only to watch for a DIRECTIONAL MOVE
one TECHNICAL reason for undecisive move is ADX moving down.
SENSEX:supports are still intact even after a big down candle on Monday and yesterday SENSEX opened low but recovered in the later half of the day
Levels point of view there is no change in my basic view which is that the short term trend is still up till SENSEX remains above 16544-16494
But better is if SENSEX can regain the lost grounds of MONDAY which again is my old level of 17120

NIFTY: 5133-5217 REMAINS the STRONG RESISTANCE zone for NIFTY and a WEEKLY CLOSE above it would be the best thing to have happened with NIFTY in recent past.
To be able to DIGEST the sell off of Monday NIFTY should remain above 5031 for today and as I had said a CLOSE below 5020-4994 would be the critical signal of the RECENT RALLY to end
A close above 5156/5191 would also be a good sign for today.

Tuesday, June 19, 2012

@RESISTANCE


SENSEX:16920-17120 was very very clearly described as STRONG RESISTANCE ZONE and my preference was even tough as I had been repeatedly saying that SENSEX has to close a WEEK above 16920-17120 zone for a BUY ON DIP kind of bullish situation.
16544-16494 is the support zone for next few days and if SENSEX closes below this zone in next 1-2 days then it may end the recent up move
SENSEX will have to close above 16944 very quickly for ANY bullish hopes.


NIFTY: the TOUGH ZONE of resistance as REPEATEDLY being described was 5133-5217 and NIFTY made a high of 5191 and bang, there was a huge supply which triggered a big down move for the day
Incidently NIFTY could not cross the 200 day EMA also
5020-4994 is the support zone as of now and a NIFTY close below this in a day or two would put an end to bullish hopes.
I said NIFTY NEED A WEEKLY CLOSE above 5133-5217 AND then a small correction would be good but yesterdays fall is severe enough to end the recent up move unless NIFTY can again capture 5133-5159 levels today.

SYSTEM ON AN EVENT DAY


Monday, June 18, 2012

A FEW SNAPSHOTS FROM TRADING SYSTEM


WEEKLY CHART BOOK


WEEKLY TECHNICAL VIEW FOR SENSEX & NIFTY :
At times market moves are hard to ACCEPT especially if you have PRE SET OF BELIEFS out of your own prediction.
In our case I had used MULTITIME FRAME CHARTS to try & understand what markets can do
Two weeks back I was of a firm belief that our markets are bound to ATLEAST TEST October 2011 lows
For SENSEX a move up to 15100 and 4538 for NIFTY was almost imminent BUT suddenly there was some good bullish developments on the possible LOWEST TIME FRAMES that I can use as I do END OF DAY analysis while reporting.
4758-4767 ZONE was identified as a support and 16002-15800 for SENSEX and despite EXTREMELY BEARISH SENTIMENT bears could not breach these levels on SECOND ATTEMPT and there I suggested a possible reversal is ALSO POSSIBLE.
And as both indices moved beyond their first RESISTANCE levels without any difficulty I gradually turned bullish for the SHORT TERM then a small help came from the 5/8/13 EMA BAND CROSS OVER which generated a buy on EOD CHARTS.
Last week there was a STRONG BULLISH CANDLE REVERSAL PATTERN and now we are seeing supports working.
Till supports around 4995 and 16485 works we have to be on long side.


As one can see on the CHARTS both SENSEX & NIFTY has taken supports at 200 WEEK SMA & EMA on WEEKLY CHARTS and at the same time both these INDICES are at their respective 200 DAY SMA & EMA


So MARKETS are bullish BUT may be only for the SHORT TERM
I would prefer a STRONG BULLISH CLOSE above 17120 and 5217 for SENSEX and NIFTY and then a small correction to enter long, this would be an ideal bull set up for the intermediate term but AS OF NOW we can not ignore the STRONG RESISTCE ZONE placed at 17120-5217.
So for the NEXT WEEK watch these resistance levels and also watch supports around 5084 and 17485 for NIFTY and SENSEX respectively.
Any TREND REVERSAL initiates from DAILY CHARTS and spreads its wings in to HIGHER TIME FRAME charts
We have seen supports working around 4760 AND resistance levels were ignored and then we had seen a BULLISH PATTERN on WEEKLY CHARTS and now as you can see this SENSEX MONTHLY CHART where there is “PIERCING LINE “ CANDLE REVERSAL PATTERN in progress
The month END is still 7/8 working days away but if this MONTH ends above 17120/5217 for SENSEX & NIFTY respectively but we have a ray of hope building up even on MONTHLY CHARTS.


Friday, June 15, 2012

RESISTANCE ZONE WORKS


SENSEX:RESISTANCE works and converts the buyers in to sellers
Remember that I had suggested the levels of 16920-17120 as a STRONG RESISTANCE ZONE since long.
The CANDLE PATTERN called an EVENING STAR which is a STRONG REVERSAL pattern more so because it has developed from the HEAVY SUPPLY ZONE of 16920-17120.
As can be seen on SENSEX chart SENSEX also got RESISTED at 200 DEMA and 200 D SMA now watch the support zone of 16544-16494 in next two/three days
The move started from yesterday will be a small mild correction if SENSEX does not close below 16544-16494 but a close below 16494 can put the last upmove in real danger


NIFTY : for NIFTY also it was a TOUGH ASK to cross the hurdle of 5133
The STRONG RESISTANCE ZONE of 5133-5217 has been being mentioned on NIFTY CHARTS and my TECHNICAL VIEWS since more then a month.
Yesterday I suggested that if NIFTY sustains below 5084 it will be a sign of caution for longs
NIFTY touched 5081 and bounced back but again failed to cross 5133 and once below 5084 again it was all in RED.
5020-4982 are two important NIFTY levels to watch as support
If NIFTY CLOSES BELOW BOTH OF THEM on any day within next 2/3 days the up move from 4760 will also be only a BEAR MARKET RALLY
Do not forget the expected intermediate up move above 5133-5203.


Tuesday, June 12, 2012

TECH VIEW


SENSEX:the RESISTANCE ZONE was shown very clearly on the SENSEX chart
It was and it remains in between 16920-17120 and SENSEX after opening with a GAP UP made a high of 16900 but could not even cross 16920
Remember that this price zone was A STRONG SUPPORT ZONE before APRIL 2012 so once broken this zone is supposed to work as a RESISTANCE ZONE.
If the last leg of the upmove has any strength the SENSEX should make a HIGHER BOTTOM against the lows around 15800 be better if 61.8% retracement does not get broken
16173 is the 61.8% retracement for SENSEX.

NIFTY:5133 was the first hurdle as NIFTY made a HIGH of 5125
The STRONG RESISSTANCE ZONE is 5133-5217 so do remember that a STRONG INTERMEDIATE upmove may begin only if we get a WEEKLY CLOSE above this zone
And before NIFTY can attempt this we should have one HIGHER BOTTOM above 4760 and I would prefer a higher bottom above 61.8% RETRACEMENT of the last upmove from 4760-5125.
First caution for longs was the RESISTANCE ZONE next will be breach of supports at 4995-4949.

Monday, June 11, 2012

WEEKLY CHART BOOK


WEEKLY TECHNICAL VIEW FOR INDIAN MARKETS:
It is indeed a very SMART pull back luckily there was not even a FALSE BREAKDOWN below my support levels
As in my last WEEKLY CHART BOOK I was clearly having a BEARISH MIND SET BUT it was ONLY AND ONLY if NIFTY WAS TO CLOSE BELOW 4803-4760 LEVELS AND SENSEX WAS TO CLOSE BELOW 15809-15840 ZONE OF SUPPORTS.
In that circumstances I feel lucky as not advising my readers to SHORT EVERY RALLY.
In January 2012 I had given an upside target of +2000 points from 9500 levels and +600 points for NIFTY above 5021 and at that point of time my advise was simple and clear BUY ON DIPS
But this time I was shy giving an advise to SHORT EVERY RISE.
Last week on Tuesday it self as I mentioned OVERSOLD STOCHASTIC I suggested that as NIFTY has not broken supports at 4767-4757 levels we may have another rally on cards.
For such an upmove my condition was clear as well that NIFTY & SENSEX will have to cross immediate hurdles BOTH INDICES immediately responded and crossed their nearest RESISTANCE LEVELS and it was indeed a VERY GOOD week indeed.
SENSEX and NIFTY may have initiated a STRONG BULL MOVE which can be called as an intermediate up move BUT WE MUST SEEA “ HIGHER TOP- HIGHER BOTTOM “ formation on EOD CHARTS.
And after we see a STRONG HIGHER BOTTOM SENSEX must cross 17003 in a whisker and NIFTY must close strong above 5133-5217 levels.
As we look at the NIFTY CHART we can easily find out that the ZONE OF 5133-5217 WAS A STRONG SUPPORT AREA which was broken in MAY 2012 so these levels will work as STRONG RESISTANCE LEVELS


Friday, June 8, 2012

MY TECH VIEW AND MY TRADING SYSTEM

CHART SPEAKS :


TECH VIEW


SENSEX:SENSEX touched a very important LEVEL OF RESISTANCE and closed mildly lower then 16671 as it made a high of 16680.
I would prefer a WEEKLY CLOSE above 16671
But in any case the recent up move is a good one and if we do not see markets loosing too much ground SENSEX will complete with a CANDLESTICK reversal pattern called BULLISH ENGULFING LINE on its WEEKLY chart.
This is encouraging but we need to see EMA CROSS OVERS on EOD charts happening to generate a buy call .


NIFTY: it was a good positive close for NIFTY above 5039
If NIFTY closes the week as on today above 5039 it will be even better and a weekly close above 5039 will suggest that there can be another rally after a MILD CORRECTION.
As in SENSEX here too we need to see an EMA CROSSOVER as buying confirmation on DAILY CHART.
And one can see that the 5-8-13 DAY EMA is giving a good BUY CROSS so for NIFTY to maintain bullish ness it must remain above atleast 5 day EMA which is valued at 4941
And LEVEL WISE for BULLISH NESS to continue NIFTY MUST NOT CLOSE BELOW 4954.


Thursday, June 7, 2012

A SMART TURN AROUND


WE MUST FOLLOW MARKETS, AS MARKETS WILL NEVER EVER FOLLOW US.
SUPPORTS WERE NOT BROKEN AND FIRST RESISTANCE LEVELS HAS BEEN TAKEN OUT,
SO................GHOOM JAO.


SENSEX: crossing two short term NEAREST HURDLES was the first important step SENSEX took yesterday in its may be a renewed journey towards a VERY GOOD bounce back which should now cross the recent highs.
There was some hint of STRENGTH in a few stocks and SBI was mentioned about a few days back
For SENSEX the emergence of support at my suggested levels of 80% retracement around 15800 was the first clue and so I did suggested clearly yesterday it self that although there is weakness on HIGHER TERM charts any up move can emerge from EOD CHARTS only.
16671 is the minimum upside we should see and if crossed 16920-17022 are next up side potential targets
A CLOSE below 16218-16086 should be protective stop for longs.

NIFTY:4882-4889 was first HURDLE ZONE and as NIFTY crossed that at open the intentions of the market was quite clear
If someone noticed yesterday it was FUTURE NIFTY which flirted with 4939 a few times in the day before the final jump to close above both important hurdles.
NIFTY not closing below 4803 and infact taking support at 4760 was just one hint and crossing two critical hurdle is the confirmation of some real strength on NIFTY EOD CHART.
Do remember that all my down side TARGETS were to open up only on NIFTY CLOSING BELOW 4803.
Some RESISTANCE at 5039 above which NIFTY will see 5135-5160.
A weekly close above 5039 will confirm a DOUBLE BOTTOM pattern on daily charts and a further WEEKLY CLOSE above 5160 will put NIFTY ON STRONG INTERMEDIATE UPMOVE.
And in this case EVERY DIP will be a BUY once again.

Wednesday, June 6, 2012

TECH VIEW


SENSEX:SENSEX made a HIGH OF 16138 and closed at 16020 as I had suggested that SENSEX will have to close above 16086-16118.
Very important hurdle and POSSIBLE UPSIDE TRIGGER for SENSEX will be a CLOSE above 16295.
STOCHASTIC is oversold on EOD chart so it can TRIGGER some up side TILL the lows around 15809 is held on CLOSING BASIS.
WEEKLY & MONTHLY charts are negatively biased but if we see SENSEX closing above 16295 there can be a short term turn around and reason is very simple that despite BEARISH EFFORTS the earlier lows are still intact on closing basis
A CLOSE BELOW 15809 AND we will see a very sharp down move again.

NIFTY:4883-4889 was first hurdle zone for NIFTY as I said NIFTY has to close above these levels and NIFTY although made a HIGH of 4898 but closed at 4863
Another crucial zone of RESISTANCE is the BEARISH GAP at 4949-4982 if NIFTY closes this GAP it will be FIRST BULLISH SIGN for the short –medium term.
So despite visible BEARISH NESS on long term charts WE MUST CONSIDER SHORT TERM POSITIVE as possible trigger event.
A weekly close above 4982 will be very positive.
BUT if NIFTY faces resistance in the zone of 4882-4982 and closes below 4758 on any day it will definitely resume the down trend.


Tuesday, June 5, 2012

TECH VIEW


SENSEX:there was another attempt from BULLS to protect the earlier lows of SENSEX around 15800 and infact as expected SENSEX opened with a GAP DOWN even went below previous lows but recovered smartly closing above the earlier lows at 15809 and 15847
SENSEX will face resistance 16086-16118 first and then the BEARISH GAP at 16277-16295 will be a tough zone.
If SENSEX does not break 15809 on CLOSING BASIS and CLOSE ABOVE 16295 in this week we may be in for another upside.
But before going long one must wait for SENSEX to first close above 16118 and better above 16295
A GAP in general works as a RESISTANCE so if SENSEX closes above 16295 it will be a very bullish sign.

NIFTY: for NIFTY the earlier BULLISH GAP between 4758-4767 once again worked as a support
A few days back FUTURE NIFTY took support at this gap as it made a low of 4767 and yesterday SPOT NIFTY INDEX made a low of 4760 and we did see a close back above 4803
This is the precise reason why I mention a CLOSE above or below levels to prefer a confirmed break out
On last Thursday I had suggested that if NIFTY CLOSES below 4830 it will be bad sign NIFTY made a low of 4831 and closed at 4841 yesterday NIFTY made a low of 4760 but yet again closed at 4848
So now I would prefer a close below 4758 for the down trend to resume
On the upside plenty of RESISTANCE zone first will be 4883-4889 and second zone will be the BEARISH GAP at 4949-4982 levels.
So for a STRONG UPSIDE NIFTY must close above 4982.


Monday, June 4, 2012

WEEKLY CHART BOOK


TECHNICAL VIEW FOR THE SENSEX & NIFTY for the week ahead and BEYOND FOR 2012:
If one reads the NEWS HEADLINE of the last week one would read analysts world over saying that the markets are in CHAOS
DOW AND S&P BOTH INDICES HAVE GIVEN CLOSE BELOW THEIR RESPECTIVE 200 DAY EMAS,which clearly suggests that the US MARKETS are also entering BEAR MARKET.
Every one knows the situation in EURO ZONE
CHINA has been slowing down and if our ECONOMY does not get a big booster doze soon our markets are not going to attract FOREIGN MONEY at any rapid speed that they were used to.
This is the FUNDAMENTAL PISTURE NOW .
WARNING BELLS were whistled upon a long ago.
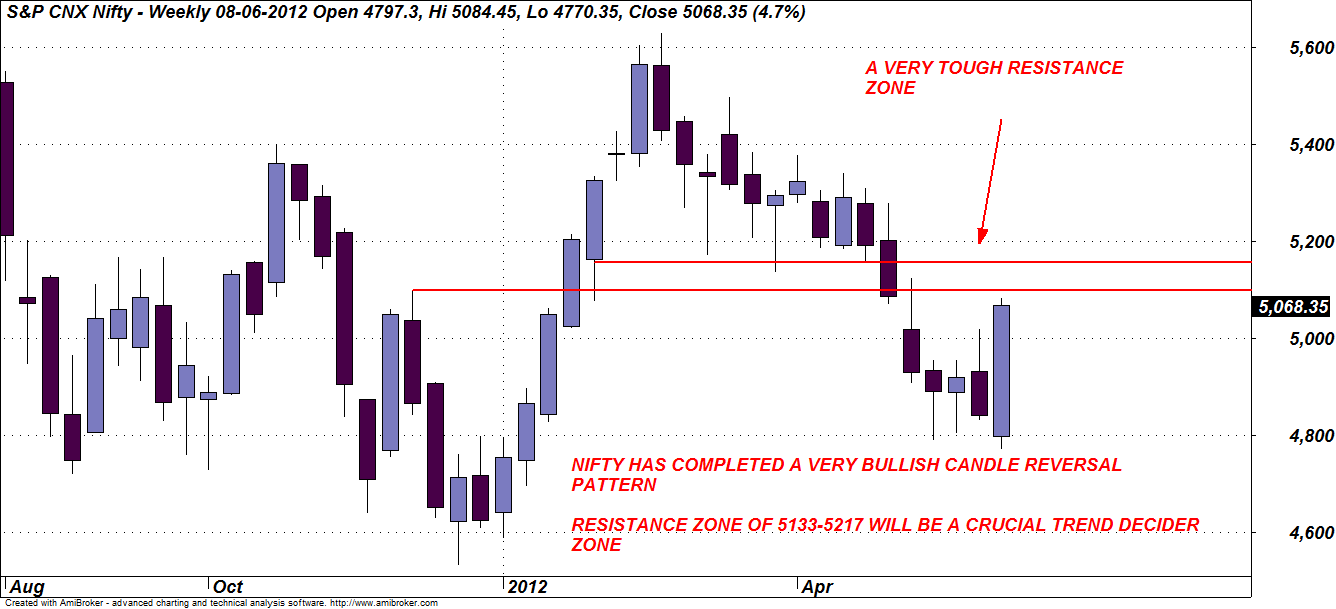
First, the present picture of SENSEX AND NIFTY as on charts
There is no BULLISH FOLLOW UP of the previous two weeks HAMMER & DOJI CANDLE PATTERN which is EXTREMELY NEGATIVE ,SENSEX could not breach 16671 and NIFTY faced very strong RESISTANCE in the very much expected way in the zone of 5016-5039.
It seems that the SMALL UP SIDE CORRECTIVE has ended at around 16500 and at 5020 for SENSEX & NIFTY and both indices are going to breach their recent lows very soon and since both indices will breach their 80% retracement levels I believe that the OCTOBER 2011 LOWS will be in danger or will be tested in coming days.
This BEARISH technical view will get NEGATED ONLY IF SENSEX closes a day above 16671 and if NIFTY closes a day above 5039.
NIFTY EOD CHART AS ON O1-O6-2012 :


I am requOting my TECHNICAL COMMENTS on NIFTY and SENSEX which were published in the WEEKLY CHART BOOK of last few weeks and those comments are very much valid from here on as well.
I said this in my WEEKLY CHART BOOK dated 3oth april 2012:
SENSEX AND 21 PERIOD EMA ON MONTHLY CHART
As shown on the chart the 21 PERIOD EMA has been working well as support & resistance for SENSEX in recent years.
In early 2012 the smart rally took SENSEX to close above the 21 period EMA for two months but as we are heading towards the end of the current month if SENSEX closes below 17364 on Monday it will be back below the EMA.
This suggests that the rally was perhaps a bear market rally only.”
The subsequent move in the month of MAY 2012 proves the point that I made clearly a month back.
MY COMMENTS IN WEEKLY CHART BOOK of 14th MAY 2012:
WEEKLY AND MONTHLY PICTURE FOR OUR MARKETS :
It looks very dicy as of now when we look at what has happened in last two weeks and the way the month of MAY 2012 is shaping up.
A sudden turnaround and a NIFTY CLOSE above 5306-5342 can only change my comments else I can see NIFTY and SENSEX breaking 2011 lows as well.
After reaching our SECOND TARGET OF 5640 NIFTY started to correct and in this correction we have just waited and waited to be BULLISH again and if you study our WEEKLY CHART BOOK since MARCH 2012 we did not say it is TIME TO BUY ON DIPS except some SELECTIVE STOCKS and except those SELECTIVE SECTORS like FMCG/AUTO and HEALTHCARE which were identified as BULLISH SECTOR to out perform the BROADER MARKETS.
Looking at WEEKLY & MONTHLY CHARTS of NIFTY SENSEX and a large number of LEADING STOCKS I am of the opinion that in next few months even 4538 is in danger.

The above suggested possibilities makes it clear that once again CASH WILL BE THE KING.
Instead of hoping that there will be again a BULL RUN one should liquidate longs and enter back at appropriate lower levels.
Do remember that I had shown the possibility of such bearish trend with corrective rallies till around 2014-2015 quite a few times in the last two years. “
The above comments are valid even today as I can not see re emergence of a BULL MARKET in the rest of 2012 we may see some corrective rallies but there will not be a major turnaround
Markets can do anything but if some one carefully follows my technical view even if markets do turn around for the better we will be with it IN TIME.