
Wednesday, December 29, 2021
New High For DOW
A Few Days Back I Wrote This , "" When Dow Enters 35670-35790 Range if there is a small correction from this range ,DOW Will again reach a New High ,Else a multi year TOP Is in place "
The Correction 35700 Was A Minor Sideways Phase And So We Have Seen A NEW HIGH For DOW


Wednesday, December 22, 2021
DOW---- UPDATE
DEDOW Trades At 35520 ,as Expected A Siginficant up move
Everything Depends upon what Happens When Dow Enters 35670-35790 Range
if there is a small correction from this range ,DOW Will again reach a New High ,Else a multi year TOP Is in place

Tuesday, December 21, 2021
DOW===U[date
Dow ,made a low of around 34750 and currently Trades ar 35130 ,an expected support zone did work BUT ,Spme more conclusive evidence needed to define weather this up move is ONLY A CORRECTIVE Or A New Upmove
Wednesday, December 15, 2021
DOW - Short Term View
Dow is Trading At 35408 Now And Its Downward Target Is 34900-35030 in a Few Days And Expect A Smart Rally From these Levels Again
Gold May Crash Up to 1600 USD In A Few Weeks Time
Wednesday, October 13, 2021
Sunday, January 29, 2017
WEEKLY Technical View
Weekly Technical View For NIFTY &
BANK NIFTY :
Our Markets Seems To Be Poised For A Great Bull Wave Which
Could Last Till NIFTY Reaches Around 10600 Levels
I Will Try To Explain Why And What Is The Technical
Requirements For Such A Strong Bull Run
First We Need To
Observe Market Move On A Budget Day And Since We Will Have A Very Strong
Bullish Candle On Monthly Charts Ideally Even If Budget Dissatisfy Markets We
Will See A Sharp Panic Which Will Be Bought into Immediately
Next Will Be A
Technical Indicator ,Stochastic Which Is Overbought On Weekly Charts And If In
Next Few Weeks This Stochastics Comes Down Without Much Of Price Erosion We
Will See An Explosive NIFTY Move
A BANKNIFTY
Weekly Chart Posted Below Shows How STOCHASTIC Behaved Early 2016 And To Take
NIFTY/BANK NIFTY Beyond 2015-2016 Highs I Believe We Will See Nearly Same Sort
Of Movement In Coming Few Weeks
Here Is The Chart :

Identifying First IMPULSE:
This Is Very Critical To Anticipate Future Moves
Last 5 Weeks move in our markets look very identical to the
bull move in March 2016 And When We Use Multi Time Frame Charts We Can Have
Even More Conclusive Technical Evidence That We Are In For A Dream Bull Run
Very Soon
As Can Be Seen On This Monthly Charts It is very Clear That
The 4 Months Down Move Was Just A CORRECTION As The Move Took Support At 50%
Fibonacci Retracement Levels ,Made Double Bottoms On Daily Chart And Now A
Strong MORNING STAR Candle Reversal Pattern On Monthly Charts


NIFTY 50% Retracement
:

NIFTY MONTHLY CHART
:

How To Visualize Targets ?
Here is how I Have Set NIFTY Targets Of Around 10800 !
Again ,Identifying 1St Impulse Is Critical
A Way To Identify Targets Is A Combination Of Gann &
Elliot
Look At This Quarterly NIFTY Chart Which Presumes That End
2008-Early 2009 Was An IMPULSE
The Last Green Arc Is the Target & A Probable Reversal
Zone Which is Way Beyond 10k In A Few Quarters With A STOP Below 7890

Look How Two Red Arcs Were Proven To Be Strong Resistance
Zones In 2010-11 & 2015-16
Another Way Of
Predicting Targets Is Reverse Fibonacci Levels
I Have Used Reversed Fibonacci Levels Of Two Different
Corrective Moves One A Larger 2015 Correction And Second The Very Recent 2016
Correction And I Have Noticed That Around 9700 And 10600 For NIFTY And 25400
For Bank Nifty We Have A Match of Different Fibo Levels As Shown On Charts Of
Both
NIFTY :

BANK NIFTY:

We Can Safely Presume That Once 9000-9100 Zone Is Taken Out
We Will See 9700-10600 Levels For NIFTY Very Easily
Candle Stick Analysis Point of view The Strong January
Monthly Candle Is A Game Changer Otherwise Weaker December 2016 Quarter Had
Suggested If There Was DOUBLE TOP Kind
Of Pattern On Nifty
The Middle Portion Of The January 2017 Candle Is A Strong
Support Now Which Is Roughly Around 8250 So Unless We Have Large BEARISH Weekly
Candle Close Below 8250 There Is A Very Very High Probabilty Of Our Markets
Attaining Dizzy Heights
Also This Strong Up Move From December Lows Suggests We Will
Have A Strong Verdict Favouring NAMO In Coming Five State Assembly Elections As
Markets Discounts The Future Well In Advance
Wednesday, April 6, 2016
TECHNICAL VIEW
Technical View For NIFTY & BANK NIFTY:
We Have Seen A Very Smart Rally In Both The Major Indices
Post Budget
A Major Event Awaited By The Markets Was RBI Policy Day And
Just Before That The Move Especially In BNF Was A Perfect Rising Channel
Yesterday That Channel Has Been Decisively Broken So Unless
BNF Moves Back Above 16000 On HOURLY CLOSING Basis I Feel We Are In For The 1st
Major Correction POST BUDGET
1st Target Seems To Be 15220 And Next 14872 But We Will See
Some Good Bounce Back From Around 15200
For NIFTY The Price Structure Seems Slightly Different And
CONE Shaped
1st Supports Around 7600 But Once We Have A CLOSE Below 7600
And 7550 (Where We Have The TREND LINE Support),We Will See A SHARP Short Term
Down Move Up To 7434
Here Are NF & BNF Charts
NF HOURLY:
BNF HOURLY:


Wednesday, March 9, 2016

Tuesday, March 8, 2016
WEEKLY CHART BOOK
A Possible Big TREND REVERSAL ?
My Technical View For The Week 08032016:
NIFTY:
A Few Notes First From My Earlier Technical Views:
In My Weekly Chart Book On 11th Jan I Said This
'' After May Be A Minor Support Around 7550-7500 We Will See New
Lows And First Probable Support/Target Zone Is 7422 Then 7330-7280 And Finally
7141-7118
But Once FLOOD Gates
Open Up PANIC SELLING May Happen And Further New Lows Can Be Possible But Not
Without Rallies In Between
We Are In 45TH Week
Since NIFTY Made Its TOP In MARCH 2015 While In 50th WEEK Since BANK NIFTY Made
Its TOP In 2015
55
Is A FIBONACCI Number So We Will Have A
Significant Bottom Around 12th Feb Or Around 19th March 2016''
In Nearly 8 Weeks Since We Witnessed What Happens When Flood
Gates Open Up Once NIFTY Breached 7118 And NIFTY Made A Very Important CLOSING
LOW At 6980 As Against Its INTRA DAY Low Of 6869 Exactly On 12Th February As
Anticipated On 11th January.
Short Term Picture Of NIFTY :
I Wrote Just A Few Days Prior To Budget That When Immediate
Resistance Levels Can Not Stop The Up Move It Will Be The First Sign Of A New
Directional Move
As NIFTY Made A PANIC LOW At 6825 On The Budget Day And 7230
Which Was First Strong Hurdle Could Not Stop NIFTY To Move Up It Was Clear That
We Are In For Some Thing Else Then A
Mere Corrective Post Budget Rally
I Had Given NIFTY Targets Of 7356-7396-7532 With A Clear
Suggestion To Buy On Dips
SGX NIFTY Has Made A High Of 7535 Today So With Such A
STRONG Short Term Up Move A Small Correction Should Be Expected Soon And It
Will Be A Welcome Correction
There Are Bullish Gaps Which Should Support And Such A
Correction Should End Above 7230
We May See Some Range Bound Move Before NIFTY Finally
Crosses The Major Hurdle Around 7550 And Should Reach 7709-7726 Once Above 7550
Medium Term :
Since The Very Recent Up Move Seems To Be A Possible New
Bull Move A Very Important Question Is That At Which Price Point The Up Move
Can Pause And What Can Be Next Targets
If The Whole Down Move Initiated From 9119 Has Indeed Ended
At 6825 The First Minimum Target Can Easily Be 7698
Next Would Be 7968
In This Case Too Any Corrective Down Move From Around 7550
Should Be Used To Enter Long
EOD NIFTY CHART:
If The Down Move Which Started From 23rd July 2015 At 8654
Has Ended At 7825 We Can Have An Upside Targets Of 7521-7736-7952
NIFTY EOD 2:
So In Both These Cases NIFTY Should Reach Around 7730 First
And 7950 Next
This Is Possible Even If The Recent Up Move Proves To Be
Just A Sharp Bear Market Rally
On Weekly Chart NIFTY Has Made A Variant Of MORNING STAR
Candle Reversal Pattern Which Too Suggests Every Dip Should Be Bought In
BULLISH GAP At 7406-7380 Is Support And Next Big Support Is
Another Gap At 7308-7222
If NIFTY CLOSEs Below 7222
Any Day Bullish Assumptions May Go Wrong But At This Juncture This Seems
EXTREMELY DIFFICULT


WEEKLY CHART :
Also Note How NIFTY Has Took Support At The Long Term Trend line
And Also At The LOWER END Of The Broadening Price Structure
Wednesday, March 2, 2016
A STRONG BOTTOM
A STRONG BOTTOM IN PLACE AT 6825-6869 PRICE ZONE:
Technical View For 02032016 And For Next Few Days:
12Th Feb Was One Date Where A Bottom Was Anticipated Our
Markets Made Their LOWs On The Same Date
At That Time I Said A Bottom Seems To Be In Place But It
Will Tested And Re Tested
Against That Low Of 6969 NIFTY Made A Low At 6970 On 17th
Feb Another Low At 6961 On 25th Feb And One Final PANIC Low At 6825 On Budget
Day
Yesterday Was Suggesting A STRONG BOTTOM Is In Place
Targets 7356-7396-7532
Buy On Dips Is Advised
Friday, February 26, 2016
Tech View
MARKET VIEW For 26022016:
NIFTY:
7037-6965 Were 1st Two Targets Below Which 6943-6865 Too
Possible And Yesterday NIFTY Did Close Exactly @6965
Looking At World Markets A GAP UP Open Is Possible And
Expect Some Up Side In The Hope For A Good Budget
7066 Is First Possible Target If NIFTY Closes 1st Hour Above
7019
7100 Will Be Next Possible Target And Resistance Too
It Is A Big Event Day Coming So Wait & Watch Must Be An
Ideal Strategy
NIFTY EOD:

Saturday, February 13, 2016

Tuesday, February 9, 2016
NIFTY TARGETs 7118-6880-6600
TECHNICAL VIEW FOR THE WEEK 08022016:
Markets Always Produces POSSIBILITIES Of Larger Moves On
Either Side So A Technical Analyst Has To Weigh Different Evidences To Judge
The HIGHER SIDE Probability
Technical Analysis Is A SCIENCE OF VISION If There Is
Clarity The Prediction Can Be On Track But When There Is Fog In The Air The
Vision Too Gets Disrupts
When There Is NO CLARITY One Should Be Honest Enough To
Accept It Till The Sun Shines To Make The Vision Clear
MIXED SIGNALS:
NIFTY May Have A STRONG BOTTOM In Place At 7230 But Once
BROKEN There Can Be A One Way Deep & Panicking Fall To 7118 And Even Up To
Around 6600
BANK NIFTY Too May Have A STRONG DOUBLE BOTTOM In Place At
14700 But Once Broken It Can Easily & Swiftly Plunge Towards 13332
So Its Better Wait And Watch
A FEW NEGATIVES :
DOW JONES AND S&P Are At SUPPORTS But Once Broken Below
Recent Lows Can Bring In Severe Panic In The WORLD MARKETs
DAX Too Is At SUPPORTs But Has Given A WORST WEEKLY CLOSE In
Many Months And Seems To Be On The Verge Of A Big BREAK DOWN
A FEW POSITIVES:
Four Leading Banks Are Showing Signs Of Immense Strength And
Will Lead The New Bull Phase From Around Middle Of 2016 Onwards
They Are KOTAK ,HDFC BANK,INDUSIND BANK,YESBANK
NSE MIDCAP INDEX Has No Signs Of Any BREAK DOWN As Yet When
We Compare It With NIFTY & BANKNIFTY
NIFTY Levels To Watch:
NIFTY Has CLOSED Above One BEARISH GAP At 7448 So If It
Sustains Above 7448 NIFTY Can Attempt The Earlier Important Resistance At 7551-7600
A CLOSE Above 7600 Will Be Again Positive
A CLOSE Below 7360 Will Be EXTREMELY Negative
BANK NIFTY:
A CLOSE Below 15145
Will Be NEGATIVE
And If BNF Closes Monday Above 15210 Again It Can Attempt At
15500-15600
A CLOSE Above 15600 Will Be Very POSITIVE
Wednesday, February 3, 2016
NIFTY VIEW
TECHNICAL VIEW FOR 03022016:
NIFTY:
Two Days Back I Suggested That A NIFTY CLOSE Above 7600 Can
Take It To Higher Levels And NIFTY Made A PRECISE HIGH Of 7600 On 1st Feb
Yesterday Too Bulls Made An Attempt To Cross 7600 But The
Was 7576
A CLOSE Below 7400 Will End The RELIEF RALLY
May Be One More Attempt Be Made From 7400-7350 Zone To Take
NIFTY Higher But Now With Yesterdays Crack The Whole PRICE STRUCTURE For The
RELIEF RALLY Seems Bearish And NIFTY Should Breach 7230 In Coming Days
NIFTY EOD:

BANK NIFTY:
BANK NIFTY Did Not Have Any Strength And A CLOSE Below 14900
Will Resume Fresh Down Move Here
Monday, February 1, 2016
TECHNICAL VIEW FOR NIFTY & BANK NIFTY
TECHNICAL VIEW FOR 01022016:
NIFTY:
In My Last Technical View I Suggested That A SHORT TERM
BOTTOM Was In Place At 7230 And A Possible Relief Rally Targets Were Set
7462-7551
NIFTY Has Managed To CLOSE Above A Crucial Resistance At
7551 So On A CLOSE Above 7600 It Can Reach 7672 And 7721-7742 To FILL The
Bearish GAP
A CLOSE Below 7400 Is STOP & REVERSE
NIFTY EOD:


BANK NIFTY:
BANK NIFTY Could Not Move As STRONG As NIFTY Because It Has
A Sharp GAP DOWN OPEN On Friday
A Move Above 15682 Can Take BANK NIFTY Towards 15790
A Close Above 15800 Can Take BANK NIFTY Up To 16108-16205
BANK NIFTY:
Thursday, January 21, 2016
TECHNICAL VIEW
TECHNICAL VIEW FOR 21012016:
NIFTY:
Another Big Gap Down And A Big Fall Followed By A SMART
Intraday Recovery But Still NOTHING Positive On EOD Charts
What Happens Normally Is That After 300-400 NIFTY POINTS
Fall There Used To Be Some Smart Recovery But This Time Around Even After Some
700+ Points Crash We Are Witnessing Only INTRADAY Rallies
Some Where It Will Stop And We Will Have A Relief Rally But
As I Said Earlier It Is Dangerous To Swim Against The High Tide
A STOP & REVERSE Would Be A CLOSE Above 7447 For
Positional NF traders
7336-7364 IS THE FIRST HURDLE TO
CROSS FOR NIFTY ABOVE WHICH IT CAN ATTEMPT
FOR 7462 AND AFTER CLOSING THE GAP IT CAN REACH 7498-7551
A CLOSE Below 7280 Would
Negate The Up Side Possibility
Since DOW
& DAX Has Reached Their AUGUST-15 LOWs Which Are Minor Supports I Am
Expecting Some Up Side But Again ONLY Above Suggested Levels With A CLEAR STOP
EOD NIFTY :
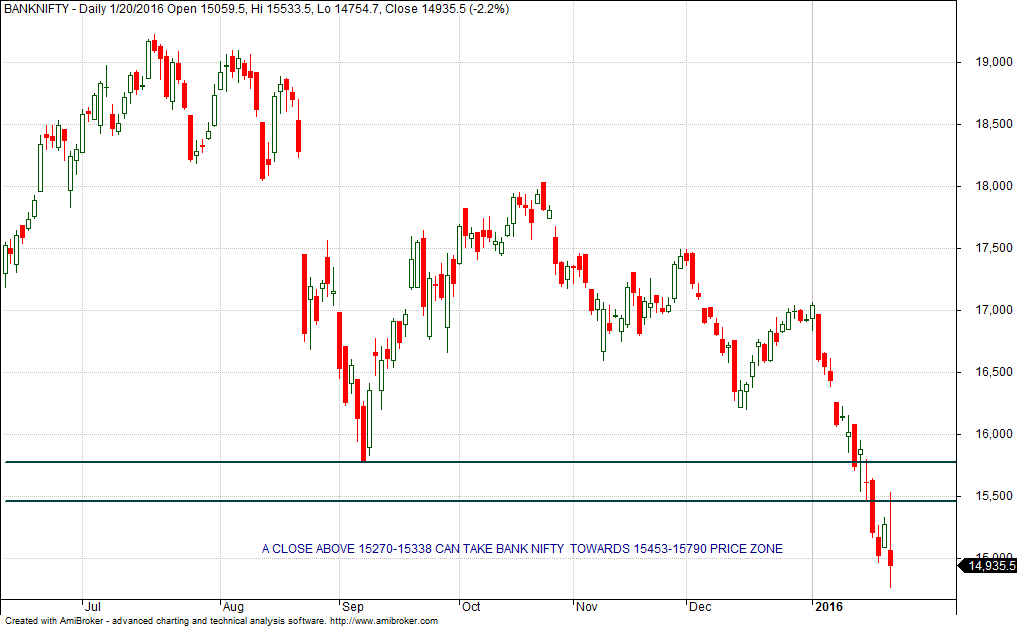

BANK NIFTY:
I Had Given
A DOWN Side Target Of 14665 For BANK NIFTY And Yesterday It Made A LOW Of 14754
My Target
Was Given When BNF Was Around 16000
A Relief
Rally Possible On A BANK NIFTY CLOSE Above 15270-15338
The TARGET
Zone Would Be 15453-15790 Which Will Again Be A Tough Resistance Zone
Wednesday, January 20, 2016
TECHNICAL VIEW FOR THE WEEK 18012016:
TECHNICAL VIEW FOR THE WEEK 18012016:
NIFTY:
First Let Us Have A Look At The Week Gone By:
On Friday My View Was Positive & Hoping For A Relief
Rally BUT Only Above Certain Levels And Neither NIFTY Nor BANK NIFTY Was Able
To CROSS My Levels And The TREND Continued
TWO Long Shadows At 7430-7452 For NF Prompted Me To Have A
View Of A SHORT TERM BOTTOM Formation But As I Have Been Consistent That There
Must Be A FOLLOW UP Bullish Candle To Confirm Bottom Which Did Not Happen
What Now ?
NF Yet To Close Below 7430 But The STRUCTURE Seems Negative
Again As NIFTY/NF Just Managed To Close At Previous TOW DAYs LOWs
Unless NIFTY Again Manages A CLOSE Above 7551 / NF Above
7561 There Will Be Selling Pressure At Every Rise
An EOD Close Above 7617 For NF Can Bring In Some HOPE Based
Rally During The Coming Week
Down Side Targets Of 7330-7280-7141-7108 Are Open
The 7330-7280 Price Zone Is A CRUCIAL SUPPORT Zone So Before
A Final Plunge NF Should See Some Support At 7330-7280
BANK NIFTY:
I Had A View That Above 15689 There Was A Possible Relief
Rally But BNF Could Not Reach There And Again Once Below 15450 My Target Of
15200 Was Met Very Quickly
A CLOSE (Hourly Close For Today) On EOD Basis During The
Week Above 15689 Can Bring In Some Relief Rally Else Fresh Selling Will Resume
Taking BNF Below 15000 Very Soon

TECHNICAL VIEW FOR 20012016:
NIFTY:
NF Did Manage To Cross 7422 And Went Up To 7474 In An
Intraday Rally But Could Not CLOSE Above 7460
It Seems To Be JUST A PAUSE After Very Heavy Selling
Pressure And If NF Manages To Sustain Above 7407 Especially For The 1st Hour Of
Trades It Can Again TRY To CROSS 7460
On A CLOSE Above 7460 We May See 7498 And 7551 In Coming
Days
A CLOSE Below 7407-7377 Down Trend Will Resume Again
EOD NIFTY:
BANK NIFTY:
BNF Has To CLOSE Above 15430 For Some Sort Of Relief Rally
Else All The Intra Day Rallies Will Be Sold Out
A CLOSE Below 15170 Will Most Probably Resume The Down Trend
Even A Few Days Range Bound Move Is Also Possible
Friday, January 15, 2016
MARKET VIEW 15012016
TECHNICAL VIEW FOR 15012016:
NIFTY:
NIFTY Has Been Extremely Volatile In Last Two Trading Days
7422 / 7430 For NF Seems A BOTTOM For Now
Because Such Volatility Can Happen Before A TOP Or BOTTOM
Formation Since We Have Seen Relentless Selling From Around 8000 We May Now See
A Rally
STOP: CLOSE BELOW 7471 Today
NIFTY EOD:

BANK NIFTY:
A Very Nice Fibonacci Setup Suggests That At 15450 BANK
NIFTY May Have Hit A BOTTOM For The Short Term
And A Relief Rally Will Be On The Cards
STOP: A CLOSE BELOW 15450
Once BANK NIFTY CLOSEs Above 15800 It Can Reach 16200-16434
For BNF An Hourly Close Above 15689 Will Confirm My View
BANK NIFTY EOD:

Please Remember That The Suggested Up Move Will Mostly Be A
RELIEF RALLY Which Will Reach 38.2% Retracement Levels Of The Recent Fall And
Medium Term Bearish Trend Remains Intact
After Watching The
STRENGTH I will Suggest What Kind Of Move Will Follow And If We Just Have A
SIDE WAYS Move The DOWN MOVE Will Continue Below STOPs Given Today
Thursday, January 14, 2016
WORLD MARKET PLUNGES HARD
TECHNICAL VIEW FOR 14012016:
NIFTY:
I Was Expecting Some Up Side Move Above 7570 Around NIFTY
Went Up To 7600 But My STOP Was 7540 And Once Below 7540 NIFTY Touched 7425 As
Our One Weekly Target Was 7422
'' After May Be A Minor
Support Around 7550-7500 We Will See New Lows And First Probable Support/Target
Zone Is 7422 Then 7330-7280 And Finally 7141-7118''
From The SUPPORT/TARGET Of 7422 NIFTY Bounced Back Sharply
CLOSING Even Above 7551
On EOD Chart It Is A LONG LEGGED DOJI ,Which Suggests A
SHORT TERM Bottom At 7425 But Needs A FOLLOW UP BULLISH CANDLE
A CLOSE Above 7620-7640 Can Be Such A FOLLOW UP
World Markets Are A BIG BIG Concern For Us Which I Have Been
Suggesting Since last Month In All my Reports
A CLOSE Below 7516 For NF And More Damage On NF CLOSE Below
7429
BANK NIFTY:
15600-15540 Was A SUPPORT Zone From Where We Had Seen Strong
INTRA DAY Bounce But BNF Need A CLOSE Above 16185 First For A Relief Rally
Below 15600-15540 BNF Can Reach 15200 Very Quickly
Subscribe to:
Posts (Atom)