Monday, September 24, 2012

WEEKLY CHART BOOK


TECHNICAL ANALYSIS OF SENSEX & NIFTY:
A small correction lasted for a few days and both SENSEX and NIFTY covered those few days losses in a single day with a massive & EUPHORIC up move taking both indices to reach new highs for the year 2012.
NIFTY FUTURE touched an EXACT HIGH of 5735 which was the NIFTY TARGET given here.
Both SENSEX & NIFTY has reached the 61.8% RETRACEMENT levels of their deep correction which was started in OCTOBER 2010 and made lows in DECEMBER 2011
18284-18062 was the suggested GAP SUPPORT for SENSEX and for NIFTY this zone was 5526-5421 and in the small correction SENSEX made a LOW of 18291 and NIFTY made a LOW of 5534 from the HIGH of 5652
Both indices finished that small intraweek correction and humped to new highs for the year 2012
I wrote on FRIDAY that a move above 5600 can take NIFTY up to 5735 and FUTURE NIFTY made an EXACT HIGH of 5735
No sign of REVERSAL yet and after such a huge TWO WEEK long rally markets may enter some consolidation phase
5953 and 19805 can be possible TARGETS for NIFTY and SENSEX respectively provided the SUPPORTS at 5526-5421 and 18284-18062 remains intact on CLOSING BASIS.


Friday, September 21, 2012

TECHNICAL ANALYSIS OF NIFTY & SENSEX


SENSEX: IF SENSEX can close back above 18469 either today or on MONDAY one can again go long in selective STOCKS
But a CLOSE below 18062 will be a warning bell
This close should not come that easily and from this level we will see one more buying spree but as we all know markets can do anything
ZONE OF CAUTION proves to be a hurdle


NIFTY: ADX has been on the up move supporting SHORT TERM upside momentum as on DAILY CHART but still there is no SIGNIFICANT momentum on WEEKLY or MONTHLY charts being shown by ADX
PRICE has reacted adversely from the ZONE OF RESISTANCE
A NIFTY CLOSE above 5600 can take it further up to around 5735 as we analyse NIFTY on DAY TO BASIS we will consider ADX on daily chart being in momentum
If the BIG GAP gets filled in there will be another BOUNCE provided NIFTY does not close below 5421


Thursday, September 20, 2012

TECHNICAL VIEW


SENSEX: in a small range now SENSEX is facing some RESISTANCE in the ZONE OF CAUTION but no significant REVERSAL PATTERN as yet
The price STRUCTURE on WEEKLY CHART of SENSEX has two clear and significantly opposite possibilities one of a larger DISTRIBUTION and the second is DISTRIBUTION after the 2011 crash
Not possible to understand which way it will go
A small correction would be welcome and if it remains SLOW one more bounce will come
18284 is very critical low to define how the correction is

NIFTY: 5635-5740 is the zone of levels where one should be careful in longs
One must wait for CORRECTION which should not be fast and severe and if such a correction comes and remains slow one can again enter long
5525 is the LOW to be watched as a support in a few days to come
5448 is the level which will give support if NIFTY corrects that much

Monday, September 17, 2012

SYSTEM TRADING : the ONLY way to earn money in TRADING


WEEKLY CHART BOOK


once beyond 18000 SENSEX was to be in full blown bullishness and it reached the ZONE OF CAUTION shown on the SENSEX CHART in a single day
at the start of the week it was 5300-5342 which was crossed with a big move and then once above 5442 there was another big BULLISH candle with a huge GAP
Most important question is “ will the ADX move up on WEEKLY CHARTS ? “
I have no answer as i have practically learnt to JUST BLINDLY follow the markets and not to EXPECT markets to follow my own views
ADX is an INDICATOR which represents MOMENTUM in the market and the MOMENTUM can be on EITHER SIDE.
The value of ADX shows weather there is a momentum in the markets if its value is above 25 it is considered good as this high value shows that there is GOOD MOMENTUM
Typical character of ADX is that it moves up if a good up move resumes and ADX moves up even if a good DOWN MOVE starts
An ADX VALUE below 25 shows that NEITHER BULL nor BEAR is in control
ADX has been on the up move supporting recent rally as on DAILY CHARTS

This magical upmove came a BOTH SENSEX & NIFTY touched the SUPPORT TRENDLINE and also TOUCHED the earlier BULLISH GAPS and DID NOT BREACH my TREND DECIDER LEVELS of 5220 and 17292
But i expected only a bounce back and NOT such a massive rally
Luckily markets has tought me hard lessons over the last 15 years of my journey of learning the great subject TECHNICAL ANALYSIS and i have learned to GIVE my opinions about the FUTURE market moves but NEVER to EXPECT market to move in the direction i would have liked it to
Instead i have learned JUST TO FOLLOW THE MARKETS and that is precisely why i was not trapped in the recent up move even being a non believer of the massive rally
BACK TO ADX :
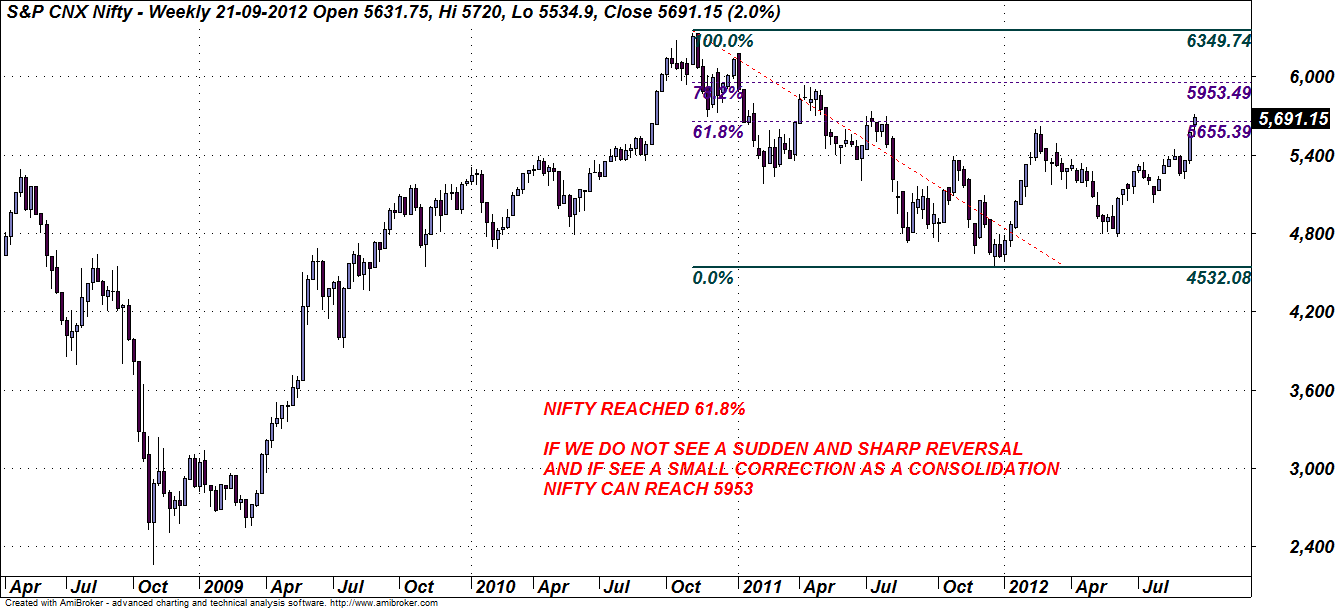
Here is the WEEKLY CHART of NIFTY with ADX :
One can clearly see that ADX was on the move on both side till OCTOBER 2011 but after that it has been moving down by each passing week

From the earlier HIGHS around 5629-5740 we should expect some correction and hope the correction to remain slow to ENTER LONG on very selective stocks
5448 and 5378 are two very important support levels
The GAP between 5536-5435 will have to be the key TREND DECIDER level for the SHORT TERM
18284-18062 IS THE GAP for SENSEX which should not be filled up and if SENSEX closes below 18062 one must remain very alert
17972-17664 is the price zone which is now most important SUPPORT ZONE for SENSEX and a WEEKLY CLOSE below these zone will be a warning bell for bulls


The SUPPORT TRENDLINE which worked in the last down move was drawn in the first week of AUGUST 2012:


Monday, September 10, 2012

WEEKLY CHART BOOK


WEEKLY TECHNICAL VIEW FOR SENSEX AND NIFTY:
There were two important points that i described in my last two WEEKLY CHART BOOKs
 one was my anticipation that the DOWN MOVE started from 17972 in SENSEX and from 5448 in NIFTY seems to be the FIRST LEG of a fresh and bigger down trend to follow next
 second despite the above analysis i had suggested a very clear TREND DECIDER ZONE of levels for NIFTY which was 5260-5220 and for SENSEX my TREND DECIDER LEVEL was 17292

My first assumption of a FRESH larger down move seems to have proven WRONG at this stage but the last two days STRONG up move came EXACTLY from my TREND DECIDER levels
SENSEX made a LOW of 17250 but closed above 17292 and NIFTY made a low of 5215 but closed above 5220 on the day both touched those CRUCIAL LEVELS
Also i was pointing clearly at one CORRECTIVE bounce from these supports here too my anticipation of small up move wet wrong as there is a very STRONG bounce
But again a CLOSE above 5300 and 5342  already suggested a STRONGER up move coming up
For the NEXT WEEK:
Unless the BULLISH GAP between 17575-17418 is broken one can not think bearish for SENSEX and for NIFTY this GAP is between 5260-5309
two supports have worked for the SENSEX one was the TRENDLINE which was drawn almost a month ago and the the BULLISH GAP support as i did mention 17292 as the most important TREND DECIDER LEVEL.

But my assumption of SLOW upside was wrong footed.
Unless SENSEX closes again below the recent BULLISH GAP at 17575-17418 no shorts are advised.
17972-18000 is a STRONG resistance zone so first we will watch these levels and then we will analyse the move
: it is ok to say that NIFTY moved up smartly once my RESISTANCE at 5300 was crossed and there was much stronger move once NIFTY crossed another hurdle at 5342-5359 BUT my technical view of slow correction to come was wrong footed.
This upmove of only two days is much stronger for NIFTY
First warning for bulls will be if NIFTY closes below 5342 next if NIFTY closes below 5300 but fresh shorts only if NIFTY closes below 5215
5448 and 5489 are upside targets if NIFTY sustains above 5342

As on the WEEKLY CHART there was no BEARISH FOLLOW UP of the evening star pattern so if NIFTY can manage a close above 5442 for this week it will be further bullish


Tuesday, September 4, 2012

WEEKLY CHART BOOK


TECHNICAL VIEW FOR THE SENSEX AND NIFTY FOR THE WEEK STARTING FROM 3RD SEPTEMBER 2012:
I had suggested a STRONG TOPPING PATTERN called HEAD & SHOULDER on monthly charts of SENSEX and NIFTY a few weeks ago
I had clearly pointed out in the article that the process will take some time and CONFIRMATION of the TOPPING PATTERN will be only below the NECKLINE BUT i suggested care for longs
Since NIFTY touched 5442 AND SENSEX almost reached 18000 i said that caution is advised for longs again
And as NIFTY closed below 5378 i repeated and suggested an end to the last few months up move
As per my understanding of charts the 3000 points up move in SENSEX from around may 2012 and 600 points rally in NIFTY does look to be only a BEAR MARKET RALLY
There was no sign of BULL MARKET RALLY at any point of time despite i was giving NIFTY targets of 5378-5442 on the higher side


This chart of SENSEX was posted in my weekly chart book of 30th july 2012 and my comments on the chart is categorical
SENSEX HEAD & SHOULDER AS ON 27-07-2012:


I wrote this on 30th JULY 2012
“  This pattern has the potential to drag SENSEX towards nearly 12000 in the medium term BUT DO REMEMBER that the pattern gets COMPLETE ONLY ON THE BREAK OF THE NECKLINE.
It is a TOP HEAD & SHOULDER.
Also note that i am not suggesting to go short right now as this pattern may take a few more months to unfold also this pattern is developing on MONTHLY CHARTS so we shall have ENOUGH TECHNICAL EVIDENCES on other LOWER TIMEFRAME CHARTS to TIME the CRASH if this pattern is going to complete in the near future. “
Looking the EVENING STAR candle pattern as can be seen on the WEEKLY CHARTS of SENSEX and NIFTY its time to create fresh shorts at weak up move which should start soon
Decisive break which will confirm an end to the last few months up move should come up soon
Level wise a close below 5220 for NIFTY and below 17208 should confirm that the rally was a BEAR MARKET rally only
For the week RESISTANCE LEVELS are placed at 5342 -5359 for NIFTY and at 17600-17712 for SENSEX and if some how both indices can close next week above these zone we will have to have a closer look