Sunday, January 30, 2011

WEEKLY TECHNI VIEW


General technical view for the week ended 28/01/2011:
“A very poor start for 2011” these are the only words by which we can describe the first month of the new year 2011.
5th November 2010 highs in both sensex and nifty  will be considered as a major top where the big bull run started from oct 2008 seems to have ended.
In our weekly report dated 24th jan 2011 we said this,
In our opinion if sensex and nifty can not create a strong bullish candle next week to handle the bear force that we have seen then the month end will finish with strong bearish note.
First it was the month of November and now the first two weeks of January 2011 when bears were in full control of the proceedings.
 this week which will be almost the last week of the month of January barring just last day which is Monday on 31st January and if sensex and nifty can not give a strong pull back rally and goes down further or remains sideways then many major stocks and indices will complete the month with very strong downside reversal patterns on monthly charts and we believe that if this happens then there will be significant selling pressure in coming weeks/months.”
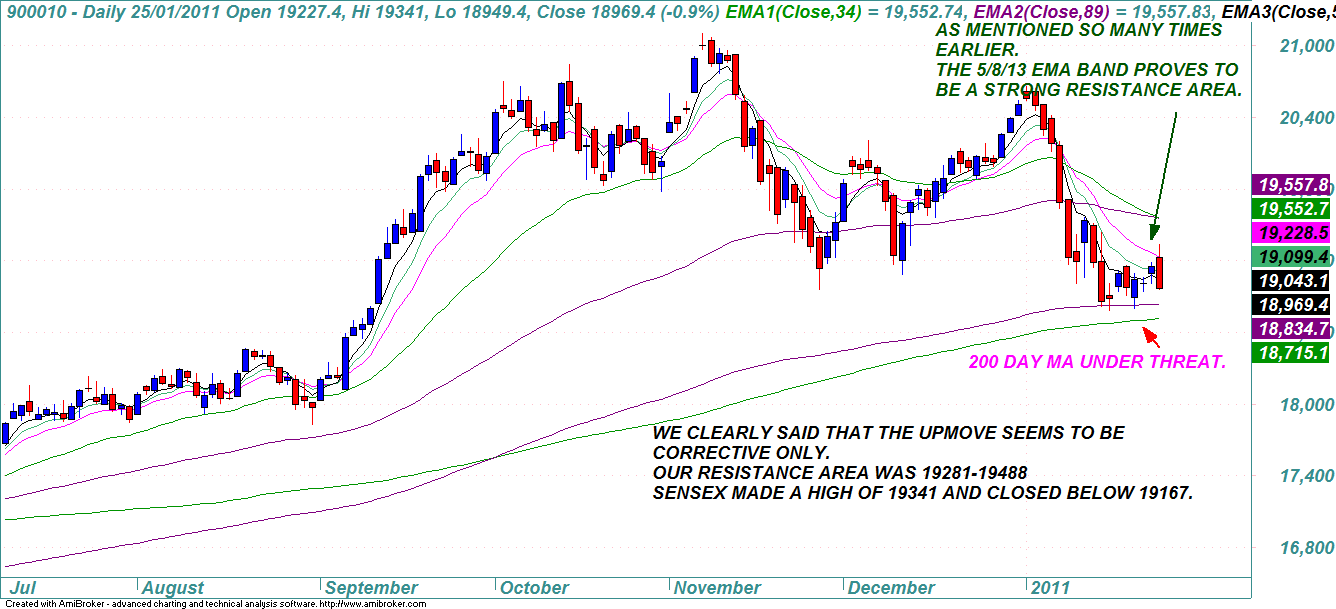
On 24th jan the markets closed with some strength but the resistance area of 5/8/13 d ema on daily chart of both sensex and nifty proved a major hurdle and for sensex a close above 19167 and for nifty a close above 5747 were our suggested levels if the upside correction was to have any momentum and on 25th jan both indices crossed these levels for few hours but closed significantly down below these levels which ended the six days volatile correction near 200 day ema and in our daily technical view on Wednesday we suggested a threat to 200 day ema for sensex and nifty and finally both indices closed the week way below their major supportive 200 day ema thus theoretically putting an end to the big rally.
We would like to take a note of what we had said about the behavior of sensex/nifty and their respective 200 day ema in last few months while we used a typical observation as one of the innovative technical tool to predict a major top in our markets way before others would have even realized that such a huge approx. 3000 points crash in sensex is coming in near term future.
SENSEX / NIFTY 200 DAY EMA AND MY OBSERVATION
ON 11th oct 2010 and then in dec 2010 i presented nifty and sensex charts with their respective 200 day ema at that time.

i suggested while writing about a probale MAJOR TOP that this time around the 200 day ema may get broken.

 it happened on 27th jan 2011.

This is what I wrote on 11th October 2010.
 200 day ema
As shown in the sensex chart, the sensex has shown tendency to test  the all important 200 day ema, TWICE  and after taking support for two times in a row (resistance in down trend),it is seen to break the 200 dema.
In our case, sensex recently tasted the 200 dema in early feb-2010 and than in late may-2010,may be the time is due for the history to repeat itself.

And here were my charts of nifty and sensex  which I presented here in oct-2010 and dec -2010.

One must remember that the 200 day exponential ma (some analysts give weightage to simple ma)is considered as major technical tool used worldwide as an important trend decider level where institutional players take entry and exit as for any markets analysts consider that the specified market has entered long term bear phase if it consistently trades below the 200 day ema.
Erosion of value since our annual meet early this month:
In our annual meet early this month we predicted a 12-18 month bear market with a tentative sensex target of 14000-15000 for the year 2011.
Here is the value erosion since then in various index /stocks were we made some negative coments and clearly advised to exit longs.
Sensex : 9%
Nifty: 9%
Bank nifty : 10%
Adag group :14-16%
Reality index: 15%
Mid cap index: 7%
Small cap index: 9%
Larsen: 13%
Jsw steel: 13%

INDEX STUDY:
Bse health index:
One of the strongest index was bse health index up to 2010 but now even this sector seems to have a major top in place.

Bse auto index :
Another index completes triple top on weekly charts.
Bse auto index is at 38.2% retracement so there can be a corrective upside but downside targets for medium term can be 8301 and 7785.

Sensex :
Sensex has clearly broken its 200 day ema on daily charts and one more confirmation of the strong bearishness came as the year long channel as shown on sensex weekly chart failed to give enough support and sensex has entered back in to the channel.
We firmly believe now that the two year long bull market has ended and thus as we have to calculate retracement for the entire rally to find out meaningful supports/targets 16021 is 38.2% of the entire rally in the medium term sensex has this target for the downside.
There can be some upside corrections which we will be tracking on day to day basis but 16021 is the major level that we will have to watch.

for coming days lows around 18800 and highs around 19500 will be stiff resistance for sensex considering these levels as wetry and find out a short term bottom if this severe selling spree continues sensex should made a panic bottom around 17767 as there can be a hope based pre budget rally .

Nifty :
Nifty has closed for two days in a row below its 200 day simple ma at 5612 and below its 200 day exponential ma at 5656 around so these levels are important levels to watch for the upside resistance.
But the real stiff zone of resistance for nifty will be 5689-5738-5801 for coming days and on the downside 5414-5337 is the zone where nifty can make a panic low.


Thursday, January 27, 2011

SENSEX / NIFTY 200 DAY EMA AND MY OBSERVATION

ON 11th oct 2010 and then in dec 2010 i presented nifty and sensex charts with their respective 200 day ema at that time.

i suggested while writing about a probale MAJOR TOP that this time around the 200 day ema may get broken.

today it happened.


my tech view for 270111


i have been saying since quite a few days that sensex has to have a sustained up move and then a close above 19167 to extend the corrective up move  to have some force.
Yesterday with banks in lead in early trades sensex crossed 19167 but found strong resistance at its 13 day ema exactly as we had said that in the up move sensex will find it tough to cross the ema band and our resistance area given in the morning was 19281-19488 sensex made a high of 19341 but failed to close above 19167 this will have strong negative impact and we advise traders that now if anyone wants to go long one must buy only and only after sensex closes above 19167.
Looking at the price structure of the last few days we feel the 200 day simple and exponential moving averages are under serious threat and should get broken in coming days.

Nifty :
For nifty we suggested resistance zone as 5779-5838 and nifty made a high of 5801 but i had clearly said that nifty must close above 5747 and nifty failed to do so as here too the 5/8/13 ema band proved to be a tough zone and a failure of nifty even to touch the 38.2% retracement levels is a bearish sign and once nifty breaks 5634 it will have downside targets of 5573/5512  within a few days.
Any upside possible only on a close above 5747


Monday, January 24, 2011

WEEKLY TECHNI VIEW


General technical view for the week ended 21/01/2011. :
Markets did  virtually nothing last week.
The range for sensex for the whole week was between 18779 and 19167 which is less than 400 points  and for nifty the range was between 5624 and 5747 for the whole week such a small range for both index clearly suggests indecisiveness for the markets .
Sensex and nifty view for the week of 24-29th January -2011:

In our opinion if sensex and nifty can not create a strong bullish candle next week to handle the bear force that we have seen then the month end will finish with strong bearish note.
First it was the month of November and now the first two weeks of January 2011 when bears were in full control of the proceedings.
 this week which will be almost the last week of the month of January barring just last day which is Monday on 31st January and if sensex and nifty can not give a strong pull back rally and goes down further or remains sideways then many major stocks and indices will complete the month with very strong downside reversal patterns on monthly charts and we believe that if this happens then there will be significant selling pressure in coming weeks/months.
Generally, the bullish candle real body of Day 1 is contained within the real body of the bearish candle of Day 2.
The market gaps up (bullish sign) on Day 2; but, the bulls do not push very far higher before bears take over and push prices further down, not only filling in the gap down from the morning's open but also pushing prices below the previous day's open.
With the Bullish Engulfing Pattern, there is an incredible change of sentiment from the bullish gap up at the open, to the large bearish real body candle that closed at the lows of the day. Bears have successfully overtaken bulls for the day and possibly for the next few periods.
The above explanation regarding bearish engulfing pattern is taken for daily chart but it is valid for any periodicity of charts as we are talking here about monthly chart.
nifty monthly chart:


The following chart of sbi was presented in the month of November 2010 just to illustrate our observation about markets which nowadays completes two candlestick reversal patterns before reversing the trend like as shown on this quarterly chart of sbi  in 2009 when it completed two candle reversal patterns before reversing the strong bearish trend of 2008.
And as shown on bse national index till 21st jan 2011 it is also now on the verge of completing two candle reversal patterns before the actual trend reversal takes place.

Quarterly picture of sector indices:
Since January 2011 is the first month of current quarter and our observation regarding development of candlestick pattern suggests that for any periodicity of chart if markets  initiates a development process for an important candle reversal pattern at very early stage of that period generally it completes such reversal patterns at the end of the period.
We mean to say that suppose we are going to see a strong reversal pattern at the end of a quarter we might see its warning signals very early at the beginning of the quarter itself.
This observations helps us in having a vision of markets at the end of the quarter.
Here are few quarterly charts which shows strong bearish candle reversal pattern in the first month of the current quarter itself.
IF COMPLETED these patterns may have strong medium term impact.
Bse auto quarterly chart:


We have been talking about bearish possibilities about our markets.
But we had initiated warning bells in October 2010 since then there has been very heavy erosion of values if someone studies prices of some very active midcap and small cap stocks and some major psu and banking stocks too.
And we do not foresee a crash like what we had seen in 2008 but it will be a gradual down move which may last for 12-18 months and 3 months have been already gone also there is always a bull market even in strong bear market so as once nifty reaches our targets around 5500 (if 5748 not crossed soon) we will try and find out stocks to trade for short term bullishness as there may be a good upward correction from supports.
Levels to watch for the coming week:
Sensex:
Sensex need to close a day above 19167 to have any chance of some corrective rise on the upside and the most important levels where it can find resistance if the upside correction picks up momentum are 19496 and 19720.
Where as on the downside if closes below 18872 then sensex will find supports at 18533 and 18257

Nifty :
Nifty need to close above 5747 to have any upside correction but it will have strong resistance around 5833 and 5879 and on the downside as we are witnessing high volatility near 200 day ema so now if nifty closes below 5634 it will have faster crash up to 5556-5513 as the 200 day simple ma at 5610 may not work as support.
If in any case there is no halt around 5610 and 5556 then nifty will find strong support at 5416 in coming weeks.


Thursday, January 20, 2011

tech view 200111


SUPPORTS : 18862/18691

RESISTANCE : 1917260410Ar nifty ast stochastics/19403
TRENDS :
SHORT TERM : DOWN
INTERMEIDIATE : DOWN
LONG TERM : UP
Yesterday it self we said here very clearly that the expected correction is here but the 200+ points upmove in sensex on Tuesday looked to be only a correction and we also said that unless Larsen/reliance/bhel starts moving up the rally can not pick up momentum and all these three biggies did not get any upside trigger in price action and sensex found stiff resistance at 50% retracement of the last leg of crash and with reliance and sbi leading the crash sensex at one stage was down by 180+ points.
Sensex closed at -113 points shows that the correction may have ended with a short term channel on eod charts we can have further downside targets for sensex atleast upto 200 day sma and further upto 50% retracement level of last big rally which are at 18690 and 18539 respectively

NSE NIFTY (5691.05)
SUPPORTS : 5650/561032.70TY (6121.6901
RESISTANCE : 5750/5817

Nifty also opened a little high on taking cue from strong asian markets but initially with Larsen going down heavily nifty went in to red but bounce back on strong metal sector recovery but then with sbi and reliance taking downside lead nifty went below Tuesdays lows but recovered 30+ points still closed below 5700.
If nifty future trades and closes below 5638 today we strongly feel that it may break its 200 day simple ma also which is at 5609 and nifty may have down side target at 5556 and 5507


Chart – I

SENSEX ADX 190111.png
                   
(All Price Charts as on 19th JANUARY 2011)

ADVANCE / DECLINES
BSE
Advances
141678059.0999647.77day ema is placed at 18408 as on yesterday.ns would be very very severe and the next minimum target for sensex could  ea
Declines
1387
Unchanged
190

BSE TURNOVER (Rs. In Crores)

Cash
3476.86
Future
--
Total
3476.8676.86

KEY SENSEX AVERAGES
Daily
Short Term Avg
19388
Near Term Avg 1
19688
Near Term Avg 2
19606
200 EMA
18827


Monday, January 17, 2011

weekly tech view: 170111

Sensex:
Friday turned out to be the day with huge volatility perhaps the most volatile day in a few months.
Sensex first made a low below 19000 and then rose smartly up and at a point it was even up by 170 points but once again the selling pressure resumed and the selling was so relentless that in no time sensex breached the major support zone of 19000-18954 and closed very much near the 200 day ema.
For today and for a few days the zone between 19000 and 19250 will be a strong resistance zone and if sensex  breaches its 200 day ema which is at 18827 the first support from where we expect a very strong counter attack from bulls is 18501.

Nifty:
Nifty also witnessed huge volatility and this is a normal observation that such volatility occurs at some very important support as in our case 5700 was such a support that both bears and bulls put their best effort to protect / break such an important level in a hurry and we predicted the target of 5646 at the beginning of last week as it is 200 day ema and as expected after taking a formality halt nifty arrived at 5646 with a bang.
We expect more volatility at around 200 day ema at 5646 and 200 day sma which is at 5606 and nifty may take some convincing support at 5556 which is 38.2% retracement level of the last big bullish leg.

weekly view:
Weekly technical analysis review:
On Monday at around 5830 we said on a chart of nifty that there will be a formality halt to the downside  move for a few days before another leg of crash coming and our first target was 5646 which was the value of 200 day ema and after four days sideways and rangebound move between 5700 and 5865 nifty or sensex were not able to reach even 38.2% retracement levels and on Friday nifty closed exactly at 5645.
Stocks like Larsen ,jsw steel ,icici ,idfc and iob which were presented as short sell candidates since last week were bitten down heavily and bank nifty has been our focused index with strong bearish view from above 12000 when we gave first down side target of 11300 and our next target was 10648 and on Friday bank nifty closed at 10432 and lost 5.6% during the last week.

Another big sector index which we covered with a strong bearish view was bse cgs and especially when it formed a triangle pattern we clearly said that a break of this triangle will have significant impact of future of our markets as a whole.
Here is the chart of bse-cgs index with earlier comment and the result.
This index lost hefty 10.1% after it broke the triangle.

This is a glimpse of past now let us focus on the week ahead.
Sensex :
In our annual meet we presented our strongly bearish view for the year 2011 but such bigger targets never come in a straight fall corrections are bound to be part and parcel of any big move.
Where do we expect a corrective up move in sensex ?
Here is the chart of sensex with a support line drawn from which a corrective bounce is possible.

18090 so watch these two levels to buy some strong stocks for a good pull back rally may be on a budgetary hope.
We presented our observation of Fibonacci retracement levels matching at a certain level when in early October 2010 at high around 21000 for sensex and around 6300 for nifty we arrived at a conclusion that sensex and nifty will have downside target of 19000 and 5700 respectively.
Now there is another Fibonacci level which is matched when we have compared two different legs of sensex, so for medium term we will have these levels as a good target zones.
On the chart presented below we have tried to show you the strength of bears on weekly chart as now we have lower top –lower bottom confirmed

We strongly believe that technicals are always ahead of fundamentals and when we talked about a major top on the cards three months back everyone was talking only and only about greater bull run and infact there was  no sign of weakening fundamentals and now when there is a severe fall coming in a span of just two weeks after a hope based rally in December every news paper/tv channel is flooded with news that how Indian economy has fundamental issues lurking on the horizon at macro level for 2011.
The last leg of rally in the later half of 2010 was momentum based rally and huge fii money chased momentum stocks and such funds simply gets out when it finds any sign of loss of momentum.
We clearly said in our articles rearding major top in October and November 2010 that topping is a process and that it takes some time for any market to top out and we watched sector to sector and we clearly guided every one how different sectors are being topped our one by one.
From the first week of January three major sectors started to loose momentum which were it /auto and pharma and that was the major confirmation to our belief that we will now have a lower top-lower bottom in place on weekly charts.
Nifty:
For nifty this week will have support at 5606 and 5556.
On the upside the zone between 5700-5875 will be a strong hurdle for nifty for the month.

Here is another important observation regarding 200 day ema and nifty.

We beliwe that in coming days after some more volatility near 200 day ema nifty will decisively break its 200 day ema.


Friday, January 14, 2011

5646 target done

i said here 5646 coming after a few days sideways move and here it is,5646 arrives with a bang on 4th day

correction is WEAK:

Sensex :
From morning trades sensex started to drift slowly lower and its inability to cross even Wednesdays high and not even trying to touch the immediate 38.2% retracement level which was 19621 as it made a high of 19522 was clear weakness in it.
We said on Tuesday itself that markets will have a few days corrective/sideways move and in my yesterdays conference call I said that Wednesdays strong looking up move can prove to be a one day wonder.
But in any case confirmation is needed in price action and it will be a decisive  close below 18954 especially today .
When a strong trend emerges momentum indicators can remain in overbought or oversold zone for much longer period of time so if the stochastics can not go up from oversold zone as the downtrend gathers momentum we will not be surprised.
 Nifty :
Nifty closed at 5751 which is unfortunately lowest close sinse last four months so on a closing basis this is bearish.
Nifty could not even reach 38.2% retracement level of the last fall in an attempt from bulls to give a corrective rise from supports.
In last two months nifty touched 5790 and 5723 zone on four occasions on intraday basis but bounced back strongly to close much higher but yesterday it closed below its close on any day since September 2010.
If the support at 5685-5723 still holds we may have another effort to give a pull back rally but a close below 5685 will trigger stoplosses of larger players and which will be extremely bearish for nifty and its immediate support will be 200 day simple moving average which is 5606.

Thursday, January 13, 2011

upside correction starts :WATCH ITS STRENGTH.

Sensex :
Sensex responded to the extreme oversold condition of fast stochastics and the supports at around 19000 worked even today.
In the opening trades sensex fell back to supports and started to recover in the afternoon,
Technical analysis is a great subject to learn it has the capacity to deliver hints every time about what market is going to do but as a student of the subject we have to become so flexible to absorb what the subject delivers.
The one hint after looking at the sensex/nifty/bse national/small cap/mid cap index that we are getting is a possibility of a triple bottom kind of a pattern on their eod charts. There is a long way to go for this and  we have to watch weather sensex is able to cross 61.8% retracement level of the last big crash or not than we will start looking at this triple bottom possibility.
And there is no need to have any confusion about our 2011 view of a larger c wave to unfold for a downside target of around 15000 for sensex at this point of time.

Nifty again made a low of 5711 in yesterdays panic and one must remember that when everyone was highly bullish for our markets from short/medium/long term perspective we were the first to give a nifty target/strong support  of 5700 and it is clearly evident now after even more than two months since we had given this target that 5700 is working as a support for so many days.
We have to watch what nifty does around 5937 and 5994 first if nifty reacts from these levels than we will study how the reaction is and that study will reveal about any possibility of a triple bottom reversal pattern.
5/8/13 ema band is strong resistance and adx value above 34 is another indication of momentum on bearish side but even after such bearish technical parameters if nifty becomes stronger we will be generating buy calls using intraday charts.


Tuesday, January 11, 2011

5646 coming for nifty AFTER A FEW DAYS SIDEWAYS MOVE.

Sensex :
Finally sensex breaches all support levels including 61.8% and 78.6% retracement levels of the last leg of rally and it is very important that it took 16 days to reach 20664 from around 19000 while cracking back to 19224 sensex took only five working days showing the power of bears.
All these characters of completely ignoring immediate supports and taking far lesser time in downside move proves our point of a major turning point in our market which we have been trying to prove using various technical tools  during last two months.
The 200 day ema is placed at 18809 and 2.618% retracement level of one last leg of rise is at 18745 so these two levels are one target in short term but looking at extreme ovesod condition of stochastics we may have a formaility kind of halt or sideways movement for 1-2 days.


Nifty :
For nifty too the major trend decider level was 5795 although we had warned of a major impending crash way before nifty actually crashed.
As shown on sensex chart the +di and –di has given a sharp cross signal suggesting huge downside momentum and the adx value reaching 30 is another evidence of powerfull bearish working actively in nifty.
As one can see the nifty chart we had posted one comment on nifty chart that their will be severe selling pressure below 5833 and that is exactly what we witnessed yesterday although the 200 day ema value