Tuesday, December 30, 2014

Watch 8282-8267 Range For NIFTY FUT Today

First Important Sign of a LOWER TOP Will Come If NIFTY FUT Trades Below 8282-8267 Range today
An Hourly Close Below 8267 will Take Nifty to 8213 But A More Convincing Call For A Lower Bottom Will Come If a Day Closes Below 8164

Lets Watch How Nifty Behaves For Next Couple of Days

Monday, December 29, 2014

CONFUSION : Is It A LOWER TOP Or Is It A HIGHER BOTTOM ?


Thursday, December 25, 2014

A LOWER TOP ?

As Per Norms We Can Not Confirm A LOWER TOP on A Chart Unless First Bottom Gets Breached On Closing Basis So As For NIFTY As Well
But Looking At The Supply Zone Created On NIFTY Chart Which is At A Fibonacci Zone It Seems We Have A Firm LOWER TOP In Place For NIFTY At 8370

With Bank Nifty Showing A DOUBLE TOP Pattern ,NSE 100 And NSE IT Showing Weak Patterns And A Probable BEARISH ENGULFING Candle Reversal Pattern On Monthly Chart Of NIFTY & Many Indices It Seems More Likely That A TREND REVERSAL On The Down Side Is Happening

One More Fibonacci Magic Is Showing Up on Many Banking Stocks And INDICES ,Which is That The 50% /61.8% Fibonacci Retracements Of Last Few Months BULL RUN Does Match With 127.2% / 161.8% Of The Last Corrective Up Move From Around 15Th December

This Is Dangerous

Take An Example Of NSE IT Chart
Here 50% Retracemet Is at 10307 And 161.8% of the Recent Upmove is at 10326 This Suggests That We Have Atleast A 600 Points Down Side Coming up For NSE IT


Wednesday, December 24, 2014

THE "PAUSE" AT 61.8% RETRACEMENT

Fibonacci Magical Numbers Does Work So Beautifully As We Have Seen How NIFTY Behaved at 8369

This "PAUSE" Can Turn out to be Some Thing More Severe For Our Markets

For The A NIFTY Future Trade Below 8247-8228 Will Take NIFTY Towards 8190 Levels Easily and If NIFTY Fails To Have A Strong Bounce From There We May have Seen a LOWER TOP At 8370 Level

An Hourly Close Above 8300 Today Or By Friday Will Surely Revive Hopes For The Bulls

Monday, December 22, 2014

NIFTY EOD VIEW

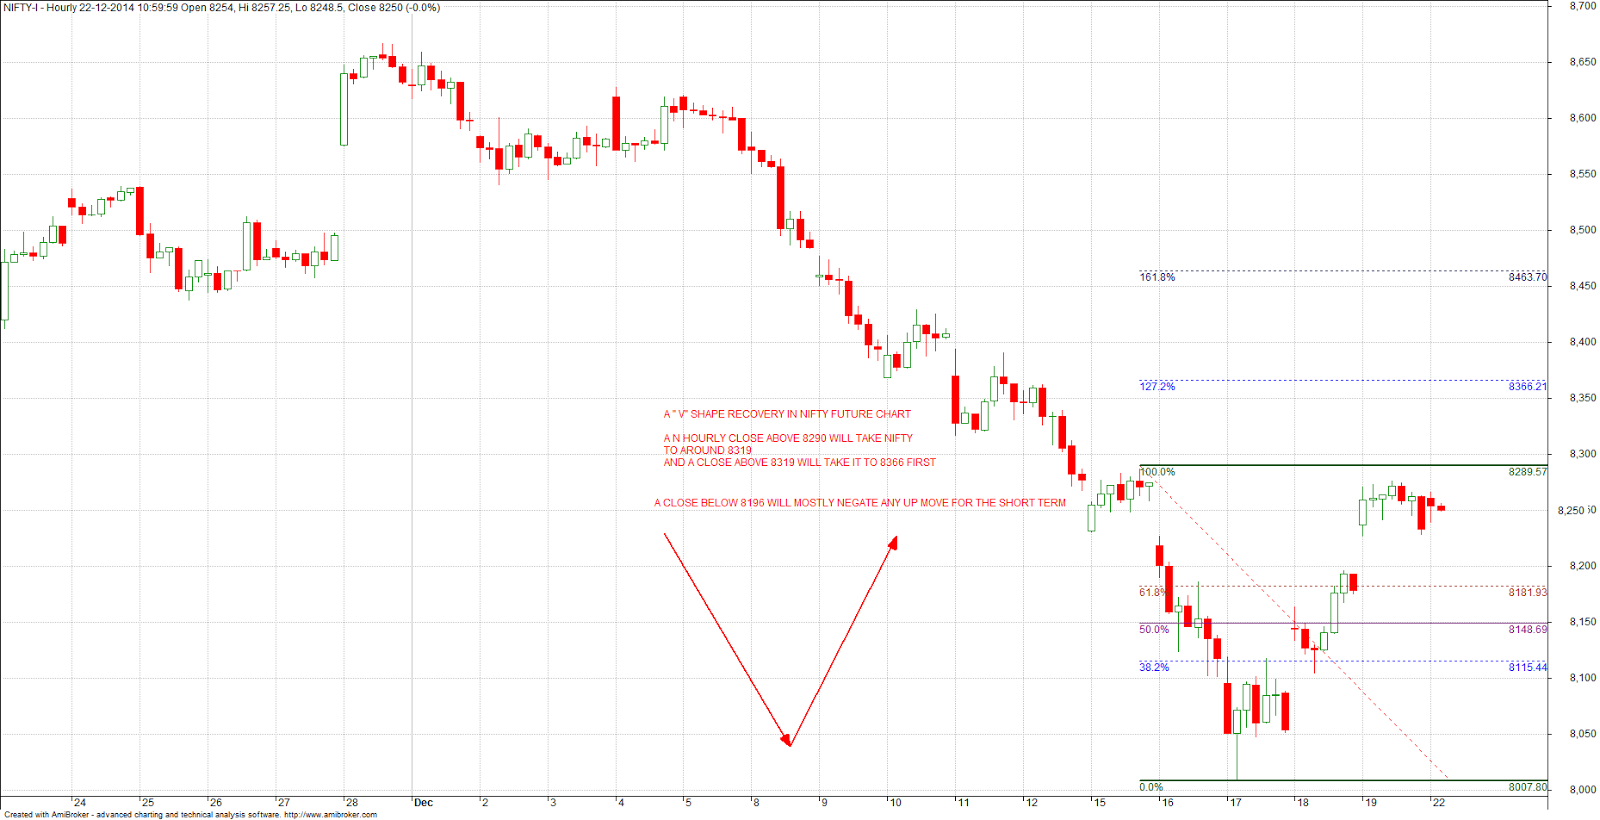
Today In The First Hour I Suggested A Strong Bounce Back Once NIFTY Crosses 8289 And That is What Has Happened In The Last Hour Of Trade

8366 is the 161.8% Of One Leg of the "V" Shape For Future Nifty Chart And 8369 Is the 61.8% Retracement Level of The Last Recent Fall

There May Be A Pause Around 8370 But Looking At The STRUCTURE Of Nifty On EOD Chart I Feel We Are Soon Headed Towards A New High To Celebrate 2015

Caution Is Advised Though As We Must Watch What Nifty Does Around 61.8% -78.2% of Fibonacci Levels

Technically The Recent Up Move Can Prove itself To Be Lower Top As well,But Surely More Weightage Can be Given To The First Possibility


NIFTY VIEW


Thursday, December 18, 2014

NIFTY NEARLY TOUCHED BROADENING PATTERN

On 17th Dec NIFTY Nearly Touched The Lower End Of The BROADENING PATTERN It was in and The Day Was Very Highly Volatile On Intraday Basis & We have Seen A Strong Bounce Back Today

Nifty Spot Will Face Resistance at 8212 First and a Higher Bottom On Intraday Charts Will Confirm a Bottom In Place Early Next Week

A Close Above 8369 Will Most Probably Take Us Back Above New Highs But Watch This Space For Further Updation


Wednesday, December 17, 2014

NO SUPPORT WORKS

The Nifty Seems To Be In The Mood of Hitting The LOWER END Of The BROADENING PATTERN Without Getting Much Fight From The Bulls

NIFTY Is at 100 DMA As On Yesterday And Last Time When NIFTY Touched 100 DMA It was A Buying Opportunity But The Structure Of Fall At That Time Was Not As Severe As it is Now

So Unless NIFTY Future Closes Above 8190 One Can Not Say That The Supports Have Worked
More Confirmation Will be On A Close Above 8290

As Nifty Was In A Broadening Pattern USDINR Was Developing A Completely Reverse --CONE SHAPE Price Pattern And It has Broken Out Of it As Well

A BIG WARNING For Nifty ?

Lets Observe Nifty Further

BROADENING Pattern Can Prove To be A REVERSAL Pattern Too


Monday, December 15, 2014

A 400+ NIFTY POINTS ON THE DOWN SIDE

It is A Pleasure to Watch Indeed As NIFTY Sheds 400+ Points Right From the All Time High

I Do Believe That This is THE MOTHER Of All Bull Markets But A Trader Can Earn Money By Correctly Identifying Even Short/Medium Term Tops in Such Bull Market As Well

I Expect An Upward Correction Should Resume Soon Before A Final Down move To Meet Broadening Pattern Supports

A Close Above 8376 Can be Some Thing Much Stronger Then A Normal Corrective Leg Of The Recent Down Move From 8625


Friday, December 12, 2014

NEAR SUPPORT

As Per Technical View Presented on 1st December NIFTY Entered In To A Very Sharp Correction

8280 Worked For A Few Hours But Broken Today And Now NIFTY Is Near Some Very Good Supports Around 8170

Expect A Pull Back Rally Next Week

A Closer Look At Weekly Charts Of Most Leading Stocks ,Only Pharma & Banking Still Seems Ok But Too Many Other Stocks Are Developing Some Serious Reversal Patterns

Tuesday, December 9, 2014

A CRASH AS EXPECTED

It is Really A Very Severe Crash On NIFTY Chart.

8280 Should Give Some Support But If The Support is Weaker Then Expect 8160-8180 Range Very Soon

Expect A Strong Bounce Back From The Lower Range.

Friday, December 5, 2014

A SHORT TERM DOUBLE TOP ON NIFTY CHART

Our Markets Are At All Time Highs But Very Recent Observation Of NIFTY CHARTS Suggested That we May Witness A Sharp Reaction Respecting The BROADENING PATTERN Shown on NIFTY Chart

As on Today We can See A Short Term DOUBLE TOP In Place On Nifty Chart

Another Observation is That At Two Points Two Different Technical Supports (LOWs & GAP) Matches With Two Different Fibonacci Retracement Levels This Gives Another Indication That We May Have A Short Term TOP In Place

A Very Clear Indication of a Further Sharp Correction Will Come On A NIFTY Close Below 8411

First Two Important Sectors That Are Facing Some SELL OFF Are Pharma And It

Thursday, December 4, 2014

IF I GO WRONG

Nifty Watchers Must Understand That As Per My Observation NIFTY Is In A Broadening Shape As Shown On EOD Chart

Also 13Th Being A Fibonacci Number Expect A Reversal in This Month With NIFTY Remaining At Another Fibonacci Level As Shown On WEEKLY Chart So I Am Expecting A Corrective Down Side Move

BUT

We Are In A Big Bull Market For Long Term So A Dip Around 8000-8200 Should Be Considered As Buying Opportunity to Breach The BROADENING PATTERN On The Upside May be Later in 2015

Monday, December 1, 2014

A MEDIUM TERM "TOP" IS NEARBY

Markets Are on the Verge Of a Sharp Correction Very Soon

Expect a 600-700 Nifty Points on The Down Side In the Next 2-3 Months

My View is Supported by Three Charts Posted Here.