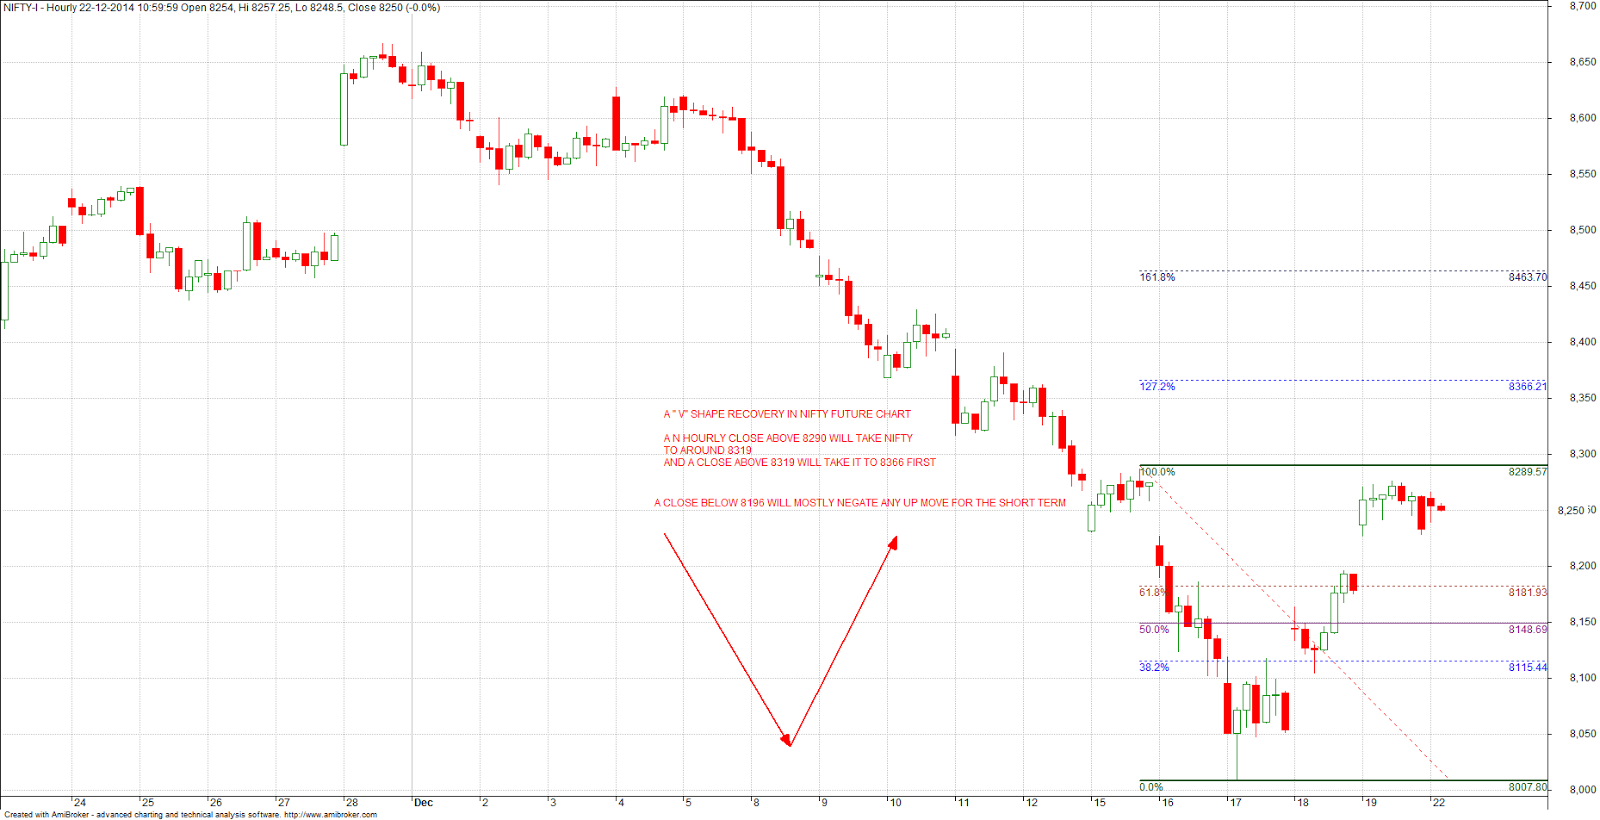
As Per Norms We Can Not Confirm A LOWER TOP on A Chart Unless First Bottom Gets Breached On Closing Basis So As For NIFTY As Well
But Looking At The Supply Zone Created On NIFTY Chart Which is At A Fibonacci Zone It Seems We Have A Firm LOWER TOP In Place For NIFTY At 8370
With Bank Nifty Showing A DOUBLE TOP Pattern ,NSE 100 And NSE IT Showing Weak Patterns And A Probable BEARISH ENGULFING Candle Reversal Pattern On Monthly Chart Of NIFTY & Many Indices It Seems More Likely That A TREND REVERSAL On The Down Side Is Happening
One More Fibonacci Magic Is Showing Up on Many Banking Stocks And INDICES ,Which is That The 50% /61.8% Fibonacci Retracements Of Last Few Months BULL RUN Does Match With 127.2% / 161.8% Of The Last Corrective Up Move From Around 15Th December
This Is Dangerous
Take An Example Of NSE IT Chart
Here 50% Retracemet Is at 10307 And 161.8% of the Recent Upmove is at 10326 This Suggests That We Have Atleast A 600 Points Down Side Coming up For NSE IT


