Friday, April 29, 2011

DANGER SIGNS


SENSEX :  SENSEX continued its downward journey with more force today as there were more participation on the down side including metal stocks small banks and most of the reality and cgs sector stocks fell sharply.
The “RESULT “ syndrome continued with BANK OF BARODA which declared results today tanked more then five percent although icici moved up from lows with very good results it will be interesting to watch icici for next couple of days.
Traders/ investors must be thinking that why should stock price come down so sharply even after companies are announcing increased profits ?
The answer lies in some BASICS of technical analysis and this basic rule says that market may be knowing something more of the future fundamentals and so market is reacting adversely now.
SENSEX has closed below one shor term support line and below 19306 which is BEARISH.
A close for sensex below 19171 and 18976 will be EXTREMELY bearish and if that happens sensex will try to take support at its 200 day ema.
Today being last day of the week if we see a weekly close  below 19171 sensex  may well have completed ANOTHER LOWER TOP.

Nifty : a close below 5759 today will be bearish for nifty as it will be bad weekly close and also on daily chart it will close below important SUPPORT LEVELS.
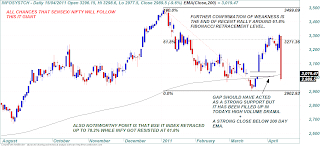
On the upside there are a few major resistance established now and the most important one is 5912 and the upper trend line which has been shown on NIFTY chart.
PLEASE remember that we have been advocating this upmove from middle of the march 2011 as a  BEAR MARKET RALLY ONLY.
And now as we are witnessing weakness on daily chart we strongly feel that NIFTY close below 5693-5649 will have very SEVERE impact on stock prices and that is the precise reason that we have advised our clients to remain in cash by more then 70%.


Thursday, April 28, 2011

LEVELS TO WATCH


SENSEX :  the resistance at 19700 has worked well for SENSEX.
IMPORTANT event in yesterdays 100 points down move is a CLOSE for SENSEX below the GAP as technically this could be first sign of BEARISH NESS as the gap has proved to be an EXHAUSTION GAP.
Our observation of market reacting negatively towards companies coming out with quarterly results has been proving on track as WIPRO came down by 3%  ACC came down by 1.3% AMBUJA CEMENT came down by 4.3% and RELIANCE AXIS AND HDFC BANK continued their downward journey with the TREND established after infy came out with numbers.
SENSEX must not close below 19306 and 19171 in next two –three days if it has to cross 19811.
Also the upper trendline is MOST important resistance line for bullishness SENSEX will have to close above it.

NIFTY : for NIFTY the EXPANDING bearish structure seems to be working and expect any bullish ness only above the upper trendline of this structure.
On the down side nifty MUST not close below 5791 and 5759  and if we see a close below these levels it will have bearish imact.


Wednesday, April 27, 2011

VOLATILITY AT MAXIMUM


SENSEX : sensex witnessed heavy selling pressure in the morning session but it recovered smartly in late trades.
Still there is nothing DECISIVE so we will have to wait for any range break out happening in coming days.
We expect more volatility in next  two days as tomorrow we will have last day of settlement.
In candle stick terms yesterdays eod candle can be termed as a HANGING MAN but expect bearish ness ONLY below yesterdays low of 19306.


NIFTY : we had nifty support at 5803 and nifty recovered from 5793 and closed back above the gapped area also as one can observe NIFTY found support at the channel upper end and 21 day ema which is placed in the KELTNER BAND.
So both supports and resistances are working but IT IS EXTREMELY VOLATILE.
A close above 5945 can trigger another upmove and a close below 5793 can trigger down ward move.


Tuesday, April 26, 2011

SILVER RALLY WITH MY TRADING SYSTEM

SYSTEM CAN NEVER EVER MISS ANY BIG RALLY....

HERE IS SILVER ON 30 MINUTES CHART.


technical view for 26-04-2011


SENSEX : sensex  was suggested to be at resistance of 19700 and sensex high yesterday was 19697.
There was some selling pressure seen at higher levels again.
Market is establishing a trend in which it is reacting adversely to most of the major stocks AFTER they announce quarterly-annual results and the latest examples were AXIS BANK and RELIANCE.
Sensex has made a SHOOTING STAR candle pattern which requires strong bear candle to confirm selling at highs and to confirm short term trend reversal.


NIFTY : for nifty also resistance around 5915 has worked for two days in a row.
The short term momentum indicator stochastics is reaching overbought zone and adx is fast loosing its up side momentum so to keep the trend on the up side NIFTY has to close above 5945.
On the other side the SHOOTING STAR candle pattern is not a good sign at all so if the GAP is filled up and if we have a big down candle than the broadening structure will work which is bearish.


Monday, April 25, 2011

LEVELS TO WATCH


SENSEX  : On Wednesday we said that a move in SENSEX above 19201 and then a close of SENSEX above 19389 will be very positive for the short term and SENSEX reached a high of 19696 above those levels.
There was a GAP up opening on Friday and this GAP should prove to be a strong support in coming days
For today and for a few days the SENSEX high 19811 which it made on 6th april is to be watched VERY CLOSELY as resistance and the GAP HIGH support at 19411 is an important level to watch on CLOSING basis.
If the high at 19811 is not crossed than we are to witness a few more days of RANGE BOUND market and we will concentrate on downside move only below 18976 and 18849 and that too on closing basis.

NIFTY :
For NIFTY we suggested strength above 5786 and 5824 and NIFTY once again touched the high of 5912 where as we gave an upside target of 5920 also notice how the 5/8/13 day EMA worked as support.
As a normal function of short term EMA taking support at higher time frame EMA was suggested earlier and as shown on NIFTY chart in the last correction the 5/8 d EMA took support at 13 d EMA.
NIFTY has strong resistance at 5942 and the GAP high at 5857 should work as support on closing basis.
We need a strong close below 5697 and 5849 for a meaning full down side corrective

Sunday, April 24, 2011

WEEKLY TECHNI VIEW


TECHNICAL VIEW FOR THE WEEK STARTING FROM 25-04-2011 :
THESE WERE OUR COMMENTS LAST WEEK :
AND THESE COMMENTS ARE VALID FOR THE COMING WEEK TOO

  A BEAR MARKET RALLY OR WHAT ??
There is no clear technical conclusion as yet
BUT WE STRONGLY BELIEVE THAT ONE WEEKLY REVERSAL PATTERN IN COMING ONE OR TWO WEEKS WILL HAVE VERY SEVERE NEGATIVE IMPACT ON MARKETS
                                                                               OR
A CLOSE ABOVE 20292 AND 6097 FOR SENSEX AND NIFTY CAN PRODUCE ANOTHER BIG RALLY UP SIDE CHALLANGING 2010 HIGHS.
The odds will be in favour of bears if indices can not cross their recent april highs next week 
PLEASE do remember that there are all chances that the late march-april 2011 rally will prove to a BEAR MARKET rally only.
 market may wait for the result season to have a conclusion of its own BUT yesterdays Infosys result and the markets reaction of a huge 10% crack can  be the markets suggestion of where it wants to go BUT AGAIN technically breach of certain levels and candle reversal pattern on weekly chart is necessary evidence that we will look out for in next 2 weeks time. “

SENSEX and NIFTY both were extremely volatile in the last weeks clearly because both bulls and bears are fighting it out for the next big move in either direction.
In our WEEKLY CHART BOOK of the last week we clearly mentioned that next two weeks will decide the future of our markets for the medium term and THOUGH our analysis weighed in favour of the next leg of bear market rally but we clearly said the we need a weekly close below the important trendline (upper end of the channel ) which we had drawn on both sensex and nifty charts.
Also there were other supports like 21 and 34 day ema and 38.2% retracement levels.one can see the updated charts and understand the logic of our arguments regarding these levels as during the week sensex and nifty tumbled earlier but took supports exactly at all those levels.
There are two things which we would like to point out. One is that we were perhaps a little bit more eager to catch the TOP at the top and second our supports in forms of the TRENDLINE , 21-34 DAY EMA ,5-8 WEEK EMA and 38.2% retracement level are more valid now as both SENSEX and NIFTY took support from these levels so in conclusion we now have CLEARLY DEFINED values below which we will presume that the next larger downtrend has resumed.
For sensex these values are 18976-18830 and for nifty they are 5697-5649 and do remember that we need WEEKLY CLOSE below these levels


BROAD MARKET :
We understand that due to increased liquidity and increased participation those days are gone when an analyst can have very high success ratio if he/she predicts the market JUST by doing analysis of A SENSEX or A NIFTY but one will have to keep in mind the broader market and sectorial indices much more closely than ever before.
And since we believe that sensex and nifty will remain in a BROAD HIGHER range for a few years and AFTER they complete the pending predicted LARGE  “ c “ wave we will witness lot of churning inside different sectors and so we have to define strong sectors and stronger stocks even among sectors which can beat the SENSEX or NIFTY in the future.
Two sectors BSE CGS and BSE POWER have got resisted at 38.2% retracement level and have completed BEARISH CANDLE REVERSAL patterns last week so WHEN NIFTY and SENSEX give us enough evidence of the fresh downward move stocks of these two stocks may witness severe selling pressure so keep watching them.


Monday, April 18, 2011

TIME TO BE IN CASH

IT IS HIGH TIME ONCE AGAIN TO REMAIN IN CASH...ZERO IN OFF ALL STOCKS / MUTUAL FUNDS ASAP.

WEEKLY TECHNI VIEW


TECHNICAL REVIEW FOR THE COMING WEEK STARTING FROM 18-04-2011 :

SENSEX : we looked the candle reversal patterns on some leading market movers which moved sharply up after a few days correction BUT our advice of buying on dips for Friday proved wrong because markets opened with gap down and Infosys led the slide through out the day.
At times such good big bullish days can also prove to be BEAR TRAPS that is what market is teaching us.
And it is actually a clash between different time frame charts which is producing such whipsaws.
As we study weekly charts the recent up move looks to be overstretched while on daily charts it was a bit oversold and as on quarterly charts it looks very overstretched and on monthly charts it looks oversold so there has been counter rallies and big size falls coming.
NIFTY :
For nifty any positive move if left will come ONLY on a close above 5923-5945 and even if that happens 6097 which is 78.2% retracement is going to be a major hurdle and such a 150 odd points rally will have to be scrutinized carefully weather the required participation is their or not.
BUT on the down side a weekly close below the TREND DECIDER line shown on chart or below 5700 there will be huge down side opening.

A BEAR MARKET RALLY OR WHAT ??
There is no clear technical conclusion as yet
BUT WE STRONGLY BELIEVE THAT ONE WEEKLY REVERSAL PATTERN IN COMING ONE OR TWO WEEKS WILL HAVE VERY SEVERE NEGATIVE IMPACT ON MARKETS
                                                                               OR
A CLOSE ABOVE 20292 AND 6097 FOR SENSEX AND NIFTY CAN PRODUCE ANOTHER BIG RALLY UP SIDE CHALLANGING 2010 HIGHS.
The odds will be in favour of bears if indices can not cross their recent april highs next week 
PLEASE do remember that there are all chances that the late march-april 2011 rally will prove to a BEAR MARKET rally only.
 market may wait for the result season to have a conclusion of its own BUT yesterdays Infosys result and the markets reaction of a huge 10% crack can  be the markets suggestion of where it wants to go BUT AGAIN technically breach of certain levels and candle reversal pattern on weekly chart is necessary evidence that we will look out for in next 2 weeks time.

AN IMPORTANT CHARACTER OF BEAR MARKET :
With the spread of internet and television media and with the availability of so many charting softwares etc. the subject technical analysis is getting immense popularity BUT my experience suggests that market itself behaves like a living entity and as it is REFLECTION of collective psychology when a LEVEL is published to most traders it DOES NOT work or A NORMALLY functioning indicator stops working.
We are trying to show you a typical character of bear market.
In the following chart of BSE IT we can see that there was a clean buy cross from the EMA band which we have used succesfuly in BULL MARKET but the latest buy cross has failed miserably in a single day on Friday .
So a typical buy call which is known to ALL has failed which suggests that WE ARE IN A BEAR MARKET RALLY ONLY.


Sunday, April 10, 2011

WEEKLY TECHNI VIEW


The most important question  now is that weather the recent rally is JUST a bear market rally or it is the new bull run ?
We have tried to answer this question and we have tried to put forward some probabilities and the ways and means to get the proper answer from future.
First let us clarify one important thing as far as our technical views our intraday and positional calls.
We are very much pleased the way things have gone by in recent months and we are much more happy how our dealers and branch/franchise personnels have started to response our technical calls and it would be very much clear now that we have such flexible technical views that we will not miss any big move of markets or major stocks in a big way on EITHER SIDE,
The MAIN reason for this is that we always FOLLOW markets and we NEVER hope the market to follow our VIEWS.
A FEW POINTS TO NOTE ABOUT THE RECENT RALLY :
Index wise the current rally has very strong momentum there has been different EMA crossovers a few indicators like ROC and RSI has turned up positively there has been BUY cross from MACD and most important feature is that the rally has touched the 61.8% retracement level straight away.
Besides all these it will be PRUDENT to note that so many times BEAR MARKET rallies can extend up to 61.8% or even up to 80% of the retracement levels.


Since the recent up move as on daily charts has gone up to 61.8% straight away it creates doubts because many a times such STEEP rallies do follow by equally steep falls but we would wait and watch any correction that comes in and it will be very interesting to watch how SUPPORTS works in future.
We have seen the 5/8/13 day EMA cross over worked in favour of bulls when it happened third time because of such steep rise the 5/8/13 day EMA band has risen sharply so we will watch how these emas gives support to sensex and nifty in corrections and how the short term ema gets support at the higher term ema.
PRICE tends to get support at 5 ema or 8 day ema if such STEEP rallies are to continue after BRIEF CORRECTIONS or if the correction comes RANGE BOUND then the 5 day or 8 day ema TENDS to get support from 13 day ema so FAILURE OF any of these will be first INDICATION of end of this BEAR MARKET rally if it is not new bull wave.
We watch CANDLE reversal pattern on WEEKLY chart and if we find any BEARISH candle reversal pattern then we will presume that this is A BEAR MARKET rally only.
We have drawn a SUPPORT line on sensex and nifty charts presented here if in coming weeks sensex or nifty closes below it then the fresh down move will resume.


LACK OF BROADER PARTICIPATION :
Another technical observation which suggests that the recent strong rally could turn out to be only a BEAR MARKET rally is the LACK of participation from broader markets in a big way.
As can be seen from some of the charts presented below sensex nifty and bankex has retraced up to 61.8% bse it out performed the sensex as it got retraced by 78.6% BUT most of other sector index retraced below 50% while small cap and mid cap index retraced just 38.2% STILL the WEAKEST sector reality index could not retraced even 38.2% till date .
Such under performance from the broader markets is the real cause of worry.
Still before calling the recent highs as ANOTHER LOWER TOP we would wait for further confirmation.


 :

Monday, April 4, 2011

WEEKLY TECHNI VIEW


A BIG QUESTION MARK ON THE FUTURE MOVE OF SENSEX and NIFTY :
is this massive  1783 points rally from the recent low of 17792 the last weeks high of 19575 in just 9 working days ONLY a correction ? or weather it is the FIRST leg of new and even bigger BULL rally ?

this is an extremely difficult question to answer but let us first identify the current trend on different time frames.
On short term that is daily charts  the trend is clearly up BUT it will a tough ask for bulls to maintain this SHORT TERM upwards bias , reasons ?
1 a  big trend line coming up as resistance
2 many such rallies turns out to be BEAR MARKET rally if the rally fizzles out near 80% retracement levels.
3. the CRUDE CHART which is in GREAT upward momentum
From medium term point of view as we study weekly charts  market may just have entered in a side ways phase in which we will not see any new high or new lows for sensex and nifty but we will see STOCK SPECIFIC movement
TWO MOST IMPORTANT TREND DECIDER LEVELS ARE ESTABLISHED FOR NEXT FEW WEEKS FOR THE UPSIDE THIS LEVEL IS 20315 AND FOR THE DOWNSIDE THIS LEVEL IS 18764.

From the LONG TERM perspective as we are consistently saying that any correction during 2011-2012 will be A LIFE TIME BUYING opportunity as sensex –nifty may pass on a few years in higher range before  BIG  breakout.
For this upward momentum to continue a HEALTHY correction will be very good and a new high around 20200 again after a brief correction will be a very good event to watch.

STATE BANK AND LARSEN AND TOUBRO :
We believe  that sbi and Larsen will decide or atleast will play very crucial role in deciding the future of our markets for a few weeks.
This is because in the current rally for sensex and nifty both these giants have not participated much and in fact have started to weaken in last 2 days so if there is any chance of the last rally being FIRST LEG of a new and larger upside sbi and Larsen MUST break their immediate resistance levels shown on their charts ELSE the rally may just prove to be a begger correction of the 4 month long down move.