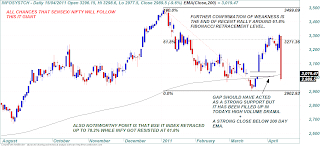
TECHNICAL REVIEW FOR THE COMING WEEK STARTING FROM 18-04-2011 :
SENSEX : we looked the candle reversal patterns on some leading market movers which moved sharply up after a few days correction BUT our advice of buying on dips for Friday proved wrong because markets opened with gap down and Infosys led the slide through out the day.
At times such good big bullish days can also prove to be BEAR TRAPS that is what market is teaching us.
And it is actually a clash between different time frame charts which is producing such whipsaws.
As we study weekly charts the recent up move looks to be overstretched while on daily charts it was a bit oversold and as on quarterly charts it looks very overstretched and on monthly charts it looks oversold so there has been counter rallies and big size falls coming.
NIFTY :
For nifty any positive move if left will come ONLY on a close above 5923-5945 and even if that happens 6097 which is 78.2% retracement is going to be a major hurdle and such a 150 odd points rally will have to be scrutinized carefully weather the required participation is their or not.
BUT on the down side a weekly close below the TREND DECIDER line shown on chart or below 5700 there will be huge down side opening.
A BEAR MARKET RALLY OR WHAT ??
There is no clear technical conclusion as yet
BUT WE STRONGLY BELIEVE THAT ONE WEEKLY REVERSAL PATTERN IN COMING ONE OR TWO WEEKS WILL HAVE VERY SEVERE NEGATIVE IMPACT ON MARKETS
OR
A CLOSE ABOVE 20292 AND 6097 FOR SENSEX AND NIFTY CAN PRODUCE ANOTHER BIG RALLY UP SIDE CHALLANGING 2010 HIGHS.
The odds will be in favour of bears if indices can not cross their recent april highs next week
PLEASE do remember that there are all chances that the late march-april 2011 rally will prove to a BEAR MARKET rally only.
market may wait for the result season to have a conclusion of its own BUT yesterdays Infosys result and the markets reaction of a huge 10% crack can be the markets suggestion of where it wants to go BUT AGAIN technically breach of certain levels and candle reversal pattern on weekly chart is necessary evidence that we will look out for in next 2 weeks time.
AN IMPORTANT CHARACTER OF BEAR MARKET :
With the spread of internet and television media and with the availability of so many charting softwares etc. the subject technical analysis is getting immense popularity BUT my experience suggests that market itself behaves like a living entity and as it is REFLECTION of collective psychology when a LEVEL is published to most traders it DOES NOT work or A NORMALLY functioning indicator stops working.
We are trying to show you a typical character of bear market.
In the following chart of BSE IT we can see that there was a clean buy cross from the EMA band which we have used succesfuly in BULL MARKET but the latest buy cross has failed miserably in a single day on Friday .
So a typical buy call which is known to ALL has failed which suggests that WE ARE IN A BEAR MARKET RALLY ONLY.


No comments:
Post a Comment