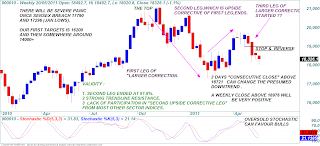
TECHNICAL VIEW FOR SENSEX & NIFTY FOR THE WEEK STARTING FROM 23-05-2011 :
For NIFTY a weekly close above 5605 (and better if above 5693} can change the tide in favour of bulls BUT a weekly close below 5343 will strongly favour bears
The present trend is definitely DOWN but as EXPLAINED in our last weeks technical view that the possibilities of a HIGHER BOTTOM is still open as long as the 78.2% retracement level of the march-april rally DOES NOT get broken on closing basis.
There are many hurdles for bulls in form of different time frame EMAS including the all important 200 DAY EMA which is placed at 5610 and our “ STOP & REVERSE “ value is placed at 5605.
Readers must remember that PRICE IS AN ACTION FROM MARKET and our prediction of FUTURE market movement is just a sort of REACTION using different tools available to us and we have to be on ALERT mode always as the market keeps changing its ACTION from one direction to other.
At times we identify the TREND very quickly because THE MARKET ACTION comes with lot of clarity but at times like this we have to keep our options to react to market open on both sides but even in such confusing times we use certain price high-lows or some Fibonacci retracement levels to identify cetain LEVELS which can decide the TREND with maximum accuracy.
For SENSEX a close below 17792 will open flood gates on the down side BUT if SENSEX manages a weekly close above 18724 and 18976 within next two weeks there will be new hope for bulls.
As we all know that RAIN GOD plays a vital role in Indian economy and first week of june is the starting time of rainy season and SENSEX / NIFTY are placed at such levels that we can safely presume a few things one is that if SENSEX AND NIFTY closes below 17792 and 5343 respectively we will have news regarding delay of rains and on the other hand if SENSEX/NIFTY have weekly close above 18724-18976 and 5605-5693 respectively we will have normal rains.
A BROADER TECHNICAL PICTURE OF SENSEX / NIFTY AS ON MONTHLY CHARTS:
Detailed study monthly charts of SENSEX/NIFTY and a few large cap stocks gives us clues regarding market move a few months down the line and index like BSE BANKEX and a few major stocks like HDFC had completed a BULLISH candle reversal patterns on monthly chart in the month of march-2011 but there was no STRONG follow up move in april and instead of that we are witnessing a stronger down ward move in many such stocks in the month of may AND if this month end remains BEARISH especially if NIFTY closes the month around 5400 and if SENSEX closes the month around 18300 we will have SEVERE negative impact for a few months atleast.
BUT we still have seven trading days left in this month so a strong weekly close above 5605 and 18724 for NIFTY /SENSEX respectively can draw a different monthly picture.
DAILY TECH VIEW :
SENSEX : as expected SENSEX bounced back with some volatility but gave a good close atleast for the day although the higher upper shadow suggests selling pressure at highs but still it was a good close.On the daily chart the candle pattern can be termed as a VARIABLE MORNING STAR and it will be interesting to watch if SENSEX can cross Fridays high of 18429.
Today if SENSEX crosses 18429 and sustains 10-15 minutes above it then there will be fair chances that SENSEX will try to reach 18724 around levels in a day or two.
NIFTY : for NIFTY if today it can sustain above 5517 it cn attempt to reach 5541 first and a close above 5541 will take NIFTY to 5605 but both these levels will attract strong selling pressure.
5604 is the 38.2% retracement level and 5610 is the value of 200 day EMA so our SAR level 5603 has lot more credibility now.
On the other hand IF NIFTY closes below 5460 in coming few days then it will put an end to all bullish hopes.


No comments:
Post a Comment