Tuesday, August 30, 2011

TECH VIEW 300811


SENSEX : SENSEX climbed back inside the 38.2% retracement level of 15990 we said yesterday that a move above 15987 and 16046 can trigger a short term up side rally and once SENSEX sustained above 16046 in the first hour there was no look back.
A LOW at 16433 and a HIGH at 16549 both these levels are crucial to be watched for SENSEX.
If SENSEX closes above 16549 today there will be a short term BUY ON DIPS kind of situation but  since this week is shortened today can prove a very dull day after a gap up open.


NIFTY :
For NIFTY we suggested a pull back rally if NIFTY can climb back above 4777-4796 and NIFTY sustained above 4796 for the first hour it self on a good asian markets.
As said earlier a stronger move will come in coming days if NIFTY closes above 4965.
Then there is a possibility of NIFTY reaching 5053 and a close above 4965 will make us believe that there will short term BUY ON DIPS like situation as NIFTY will come down as it will form a HIGHER BOTTOM against the low of 4720.
We have presented a NIFTY FUTURE HOURLY CHART and if NIFTY FUTURE  CLOSES above 4973 it will have short term target at 5020 and then A CORRECTION will form a higher bottom with STRONG SUPPORTS AT 4848.
4848 is the next TREND DECIDER LEVEL.


Sunday, August 28, 2011

WEEKLY TECHNI VIEW 290811


TECHNICAL VIEW FOR THE SENSEX AND NIFTY FOR THE WEEK STARTING FROM 29TH AUGUST 2011:
Before we proceed for the technical view for the coming week we would like our readers to have a glance at what we said about the MAJOR TOP in earlier technical views.
We request our readers to take TECHNICAL ANALYSIS a little more seriously now onwards because these two quotes taken from our earlier articles proves that if used properly TECHNICAL ANALYSIS can guide all traders and investors in the best possible manner to take the advantage of all major /minor movement of any index or any stock.
On 12th October 2010 we published a TECHNICAL VIEW and tried to prove that a MAJOR TOP was nearby.
Here is the last paragraph of that article with the SENSEX chart presented at that time.
  As can be seen on sensex chart ,since October-2009 to early sept-2010, it was moving in a channel ,which can also be called as a rectangle, the move within the channel was roughly of 2000 points,sensex broken out of the channel in early sept and has moved up by 2000 points , meeting the rectangle break-out targets.
Fibo. Retracements is an all important  technical tool used to find out supports /resistance levels.if we assume that looking at the present mood of the markets and money flow from the FIIS, IT IS ENTIRELY POSSIBLE THAT we may see 21200 level of sensex in coming days.if that happens and if we  calculate future fibbo retracements levels taking 21200 as the new high, one can see that the ONE YEAR LONG CHANNE L  , HIGH  and LOW ,BOTH becomes support  levels and also the big gap (after election 2009) area becomes one important fibbo retracement support level.
So ,concluding this article ,we can presume that one important top is nearby.
Tracking the possible top and confirming it using other technical tools, will be a job ahead.”


SENSEX made a TOP at 21108 EXACTLY in the first week of November 2010 SO  time and price wise our prediction of a MAJOR TOP was achieved with An unmatched pin point accuracy.
Here is the weekly chart of SENSEX as on today.
What happened in reality after our comments on 12th October 2010 is clear on this SENSEX WEEKLY CHART.

WHAT WE SAID IN JANUARY 2010 ?
As one can read on the following SENSEX WEEKLY CHART which was presented in our annual meet in early January 2011 we said that,
“ according to Elliott wave theory  the fall in SENSEX IN 2008 was a large A wave the up move of 2009-2010 was a large B wave and we EXPECT a down side C wave to start any time in early 2011.
And the down side target for such C WAVE will be between 13000-15000 with supports for some corrective up side around 18300 and 15500

Since on last Friday we have already seen a SENSEX low of 15765 we believe that we have achieved one important bearish target and the big question will be NOW WHAT ???
AS on Friday 26th august SENSEX has given a close below 38.2% retracement level which 15990 so for the next week we have to look if SENSEX can give a close above 15990 as a SHORT TERM positive clue.
For NIFTY this level is 4777-4796 so for NIFTY we have to look for a close above 4796 in coming week for any positive upside.
But the real good upside will be possible ONLY if SENSEX can close above 16213 and if NIFTY can close above 4965 ESPECIALLY on a weekly closing basis.
By even THINKING of any positive up move we are trying to swim against the major trend which is clearly DOWN but besides EXTREMELY oversold condition of indicators like ROC ,RSI AND STOCHASTIC ON both WEEKLY AND DAILY charts of all sectorial index and on SENSEX and NIFTY charts we have observed one technical support level around 4538 for NIFTY AND 14993 FOR SENSEX can produce a SIGNIFICANT UPSIDE CORRECTION.
We have explained how we have derived at 4538 and 14993 as such important levels.


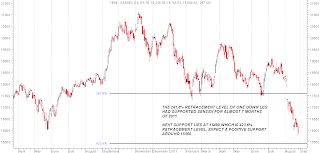
Also for both NIFTY and SENSEX the levels around 15000 and 4560 becomes a 423.6% retracement level of one important UP MOVE just before the big time crash started.

So support levels for SENSEX are at 15500 and 14993 for NIFTY support levels are 4625 and 4538 and if SENSEX and NIFTY reaches 14993 and 4538 we EXPECT A SIGNIFICANT UPSIDE and if there comes a possibility of an up move EVEN BEFORE SENSEX and NIFTY reaches these levels we have to see if SENSEX and NIFTY can give close above 16213 and 4965.
For the MAJOR TREND REVERSAL NIFTY AND SENSEX NEEDS THREE CONSECUTIVE CLOSE ABOVE 5177 AND 17300 AS ON TODAY.
WE HAVE given our comments about a few other sector indices and stocks on charts given below.




Saturday, August 27, 2011

WATCH 4538.


Monday, August 22, 2011

IMPORTANT TARGETS REACHED , NOW WHAT ??


TECHNICAL VIEW FOR SENSEX & NIFTY FOR THE WEEK STARTING FROM 21-08-2011

Finally last Day of the Week gone by was the Day on which both SENSEX and NIFTY reached our MOST IMPORTANT downside targets of 16200 and 4848.

We lately added 15990 and 4787 as our second targets and SENSEX made a low of 15987 and NIFTY made a low of 4796.

This major and very severe down move was very much anticipated when the LAST LEG was started on 26th July 2011 and in less than a Month’s time SENSEX came down from 18481 to 15987 and NIFTY witnessed a big crash from 5575 to 4796.

Before this big crash came we were firm in our opinion that the then ongoing rally was CORRECTIVE in nature and we had advocated 18323 and 5496 as MAJOR TREND DECIDER LEVELS for SENSEX and NIFTY respectively.

TARGETS REACHED, NOW WHAT ?

This would be an obvious question every one may be asking at this stage.

Targets were supports too so we can expect some sort of upside action BUT it would never be prudent and advisable to try and catch bottom because the last leg of crash can just be FIRST LEG of larger down side move yet to follow.

Still we can say one thing that the zone of 15600-15990 for SENSEX and 4538-4787 has plenty of supports which can produce upside rally but at this juncture such rallies will be only CORRECTIVE in nature and we will try and catch such upside rallies with buying calls in stronger stocks which can give some good returns.

We believe that by the end of next Week, we will have a little clearer technical picture of any possibility of an upside rally.


Friday, August 19, 2011

4848-4787 COMING SOON

I HAD TRIED TO PORTRAIT THE MARKET MOVE ON THE DOWN SIDE USING MY INNOVATIVE TECHNICAL TOOLS AND HAD WARNED EVERY ONE HERE OF A LARGER CRASH WITH CLEAR ADVISE TO BE IN CASH BY MORE THEN 70% AND WITH THE S&P 500 INDEX PLUNGES MORE THEN 4% NIFTY SHOULD REACH MY FIRST TARGETS SHORTLY.

Tuesday, August 16, 2011

SENSEX AND FTSE 100 INDEX


TECHNICAL VIEW FOR THW WEEK STARTING FROM 16TH AUGUST 2011:

ON WEEKLY charts SENSEX and NIFTY both index has broken down VERY IMPORTANT TRENDLINES and both has also given a decisive close below their respective 89 WEEK EMA in addition to this both index has given decisive close below their February 2011 and june 2011 lows on weekly basis.
TECHNICALLY this confirms that the sideways move during February-july was only A CORRECTIVE DISTRIBUTION PHASE after markets fell very sharply in the initial down side leg started from November 2010.
4848-4777 for NIFTY and 16200-15989 for SENSEX remains our first achievable targets after this BREAK DOWN events.
4625 and 15200 are our next targets for both NIFTY and SENSEX respectively BUT as usual we will see what sort of support indices takes at first targets before giving a call on these targets.
Our favourate indicator ADX is very high on both daily and weekly charts suggesting strong down side momentum.
The EMA BAND (5-8-13) IS in sell mode on both daily and weekly charts and MORE IMPORTANTLY if markets can not recover till this month end EVEN thIs EMA BAND will generate a sell call on MONTHLY CHART.

LONGER TERM PICTURE FROM CHARTS :
For our markets we had earlier compared our SENSEX move with FTSE 100 INDEX and we argued BEFORE this big time correction started that SENSEX has been mimicking the FTSE 100 INDEX SINCE LONG and the ongoing DOWN MOVE was well anticipated as a LARGER C WAVE .
We clearly observed that SENSEX IS ONE LEG BEHIND THE FTSE 100 INDEX and as per this view the current down leg in SENSEX is not going to break the earlier low of 2008 but it will last 12-18 months time and this possibility was shown in our weekly technical review dated 12th October 2010 and was repeated in a power point presentation in our annual conference early January 2011.
Here are a few charts in which we have compared SENSEX at present and compared its move with earlier moves in FTSE 100 INDEX.

Friday, August 12, 2011

LEVELS TO WATCH


SENSEX :as SUGGESTED we are having a few lackluster days SENSEX could NEITHER cross resistance levels NOR breach support level.
Such movement is a very normal after a big move takes place on either side and we have to judge the strength or weakness from supports and resistance respectively in such sideways period to judge in which direction the next leg of bigger move will come.
As mentioned earlier there is a possibility of an up move to fill up the BIG BEARISH GAP between 17358 and 17664 but even to do this SENSEX has to close above 17248 first and then above 17361 which is the value of its 8 DAY EMA as on today.
So for the day RESISTANCE AT 17248 AND 17361 AND SUPPORTS AT 16990 AND 16759 and a decisive close above or below these levels will decide further course of movement for a few days more.
On the upside it will be only a corrective rally on the down side it will be a continued down move after a pause.

NIFTY : NIFTY has got resisted at 5184 and found some support at 5121 as said earlier NIFTY needs a close above 5209 for an attempt to fill the BEARISH GAP at 5329.
In TECHNICAL terms such GAP filling is taken only as a corrective rally unless if NIFTY actually fills the GAP and we found some strength in the rally and NIFTY makes a higher bottom kind of formation .
As shown on NIFTY chart from 5209 to 5342 there are plenty of RESISTANCES so it should be an ideal short selling opportunity if NIFTY makes an attempt to fill the GAP and FAILS TO DO THAT.
A CLOSE BELOW 5116 AND 5054 will take NIFTY TOWARDS OUR TARGET ZONE OF 4848-4777.


Tuesday, August 9, 2011

NIFTY 4908 NOW WHAT ?

MY NIFTY TARGET WAS 4848 AND NIFTY MADE A LOW OF 4908 TODAY AT OPEN.

NOW WHAT ?

A FEW DAYS UP MOVE POSSIBLE, IF THIS UP MOVE CAN NOT PENETRATE 5329 ON CLOSING BASIS, 4625 WILL BE NEXT MAJOR TARGET.

Sunday, August 7, 2011

WEEKLY TECHNI VIEW


WEEKLY TECHNICAL VIEW FOR THE STARTING FROM 08-08-2011 :
In our weekly chart book dated 25th july 2011 we categorically said this “ The broad range for SENSEX IS in between 19811 and 17295 and for NIFTY in between 5944 and 5177.
Both indices has tested their respective January-2011 bottom on 20th june 2011 the important question arises is weather at june 2011 lows SENSEX AND NIFTY has ended the large correction started from late 2010 or not.
The answer is difficult but most probably they have not yet finished the larger corrective.
There is infact still a DISTINCT possibility that both indices will start another leg of deep correction from around 5750/19200 or maximum from around 5944/19811 respectively.
SENSEX and NIFTY should again re visit 17300 and 5177 respectively OR may make a HIGHER BOTTOM against 17300-5177.
If these levels are broken SENSEX and NIFTY will open up down side targets of 16200 and 4848.”
After this clear warning of a DISTINCT POSSIBILTY OF A DEEP CORRECTION NIFTY made a high of around 5700 and SENSEX made a high of 18944 and started a REAL DEEP correction which breached the earlier lows and closed the week almost at the support.
We had earlier said about the DIECY STAGE of world markets just before the BIG plunge came in the world markets.
WHAT NEXT  ?
SENSEX made a panic low at 16990 and NIFTY made a low at 5116 both were below their important support levels but both indices managed to close around supports.
But the HUGE GAP area is now a very difficult RESISTANCE for both SENSEX and NIFTY.
So TECHNICALLY any up move up to 5434 and 18032 should be considered as selling opportunities for the FIRST down side targets of 16200 and 4848 .
As STRUCTURE WISE the whole phase of CORRECTIVE bounce backs from February 2011 looks to be only a phase of distribution on weekly charts and the RECTANGLE CORRECTIVE PATTERNS on weekly charts of BSE CAPITAL GOODS AND BSE BANKEX coupled with a LARGE TRIANGLE BREAKDOWN ON METAL INDEX and a TOP HEAD&SHOULDER PATTERN on BSE IT INDEX clearly points out at a lot more panic to come in our markets BEFORE our markets starts to deviate from the world markets for BETTER.
This FRESH down move is not surprising for us NOR should it be surprising for our readers.
 the RISE OF INFLATION the HIKE IN INTEREST RATES and now the RATING DOWNGRADE OF USA are the developments  which are considered NOW as the REASONS for the huge crash happening in equity markets BUT technically the STRONG BEARISH picture for the year 2011 was drawn by us way back in January 2011 and even in October 2010 and in November 2010 we were among the first to SUGGEST that a MAJOR TOP is in place for our markets.

When we said on 25th july that another leg of downtrend will open there were no IFS AND BUTS in the statement.
We had given the 5700-5900  zone as a strong hurdle and 5496 as a TREND DECIDER LEVEL in our daily and weekly technical views in last two months and in the following chart one can see how correct these levels were.