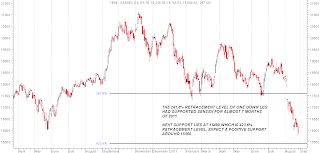
TECHNICAL VIEW FOR THE SENSEX AND NIFTY FOR THE WEEK STARTING FROM 29TH AUGUST 2011:
Before we proceed for the technical view for the coming week we would like our readers to have a glance at what we said about the MAJOR TOP in earlier technical views.
We request our readers to take TECHNICAL ANALYSIS a little more seriously now onwards because these two quotes taken from our earlier articles proves that if used properly TECHNICAL ANALYSIS can guide all traders and investors in the best possible manner to take the advantage of all major /minor movement of any index or any stock.
On 12th October 2010 we published a TECHNICAL VIEW and tried to prove that a MAJOR TOP was nearby.
Here is the last paragraph of that article with the SENSEX chart presented at that time.
“ As can be seen on sensex chart ,since October-2009 to early sept-2010, it was moving in a channel ,which can also be called as a rectangle, the move within the channel was roughly of 2000 points,sensex broken out of the channel in early sept and has moved up by 2000 points , meeting the rectangle break-out targets.
Fibo. Retracements is an all important technical tool used to find out supports /resistance levels.if we assume that looking at the present mood of the markets and money flow from the FIIS, IT IS ENTIRELY POSSIBLE THAT we may see 21200 level of sensex in coming days.if that happens and if we calculate future fibbo retracements levels taking 21200 as the new high, one can see that the ONE YEAR LONG CHANNE L , HIGH and LOW ,BOTH becomes support levels and also the big gap (after election 2009) area becomes one important fibbo retracement support level.
So ,concluding this article ,we can presume that one important top is nearby.
Tracking the possible top and confirming it using other technical tools, will be a job ahead.”
SENSEX made a TOP at 21108 EXACTLY in the first week of November 2010 SO time and price wise our prediction of a MAJOR TOP was achieved with An unmatched pin point accuracy.
Here is the weekly chart of SENSEX as on today.
What happened in reality after our comments on 12th October 2010 is clear on this SENSEX WEEKLY CHART.
WHAT WE SAID IN JANUARY 2010 ?
As one can read on the following SENSEX WEEKLY CHART which was presented in our annual meet in early January 2011 we said that,
“ according to Elliott wave theory the fall in SENSEX IN 2008 was a large A wave the up move of 2009-2010 was a large B wave and we EXPECT a down side C wave to start any time in early 2011.
And the down side target for such C WAVE will be between 13000-15000 with supports for some corrective up side around 18300 and 15500 “
Since on last Friday we have already seen a SENSEX low of 15765 we believe that we have achieved one important bearish target and the big question will be NOW WHAT ???
AS on Friday 26th august SENSEX has given a close below 38.2% retracement level which 15990 so for the next week we have to look if SENSEX can give a close above 15990 as a SHORT TERM positive clue.
For NIFTY this level is 4777-4796 so for NIFTY we have to look for a close above 4796 in coming week for any positive upside.
But the real good upside will be possible ONLY if SENSEX can close above 16213 and if NIFTY can close above 4965 ESPECIALLY on a weekly closing basis.
By even THINKING of any positive up move we are trying to swim against the major trend which is clearly DOWN but besides EXTREMELY oversold condition of indicators like ROC ,RSI AND STOCHASTIC ON both WEEKLY AND DAILY charts of all sectorial index and on SENSEX and NIFTY charts we have observed one technical support level around 4538 for NIFTY AND 14993 FOR SENSEX can produce a SIGNIFICANT UPSIDE CORRECTION.
We have explained how we have derived at 4538 and 14993 as such important levels.
Also for both NIFTY and SENSEX the levels around 15000 and 4560 becomes a 423.6% retracement level of one important UP MOVE just before the big time crash started.
So support levels for SENSEX are at 15500 and 14993 for NIFTY support levels are 4625 and 4538 and if SENSEX and NIFTY reaches 14993 and 4538 we EXPECT A SIGNIFICANT UPSIDE and if there comes a possibility of an up move EVEN BEFORE SENSEX and NIFTY reaches these levels we have to see if SENSEX and NIFTY can give close above 16213 and 4965.
For the MAJOR TREND REVERSAL NIFTY AND SENSEX NEEDS THREE CONSECUTIVE CLOSE ABOVE 5177 AND 17300 AS ON TODAY.
WE HAVE given our comments about a few other sector indices and stocks on charts given below.


No comments:
Post a Comment