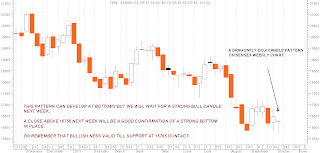
AN INTERSTING CANDLE PATTERN ON WEEKLY CHART OF SENSEX : DRAGONFLY DOJI :
Let us first read what a DRAGON FLY DOJI is all about
bullish
dragonfly doji candlestick
Bullish
Dragonfly Doji
• Direction: Bullish
• Type: Reversal
• Reliability: Moderate

• Pattern is strongest after an established bearish trend
• A candle forms with a very small to almost nonexistent body with a long lower wick
• The lower wick is at least twice as long as the candlestick body
• Little or no upper wick
In a bearish trending market the dragonfly illustrates an unsustainable sell-off, where price drives up to new lows, but buyers take control of the trend by market close.
Although this formation is a moderate to weak signal, it is a warning for longs that the downtrend is losing momentum and bull may retake the market soon.
Most candlestick analysts will wait to confirm the signal, watching for a blue candle on day two.
HERE is
the weekly chart of SENSEX as on 07-10-2011 :
The Dragonfly Doji is created when the open,
high, and close are the same or about the same price (Where the open, high, and
close are exactly the same price is quite rare). The most important part of the
Dragonfly Doji is the long lower shadow.
The long lower shadow implies that the market
tested to find where demand was located and found it. Bears were able to press
prices downward, but an area of support was found at the low of the day and
buying pressure was able to push prices back up to the opening price. Thus, the
bearish advance downward was entirely rejected by the bulls.
TECHNICAL VIEW FOR SENSEX AND NIFTY FOR THE
WEEK AHEAD :
As one can see the SENSEX chart above as on
Friday SENSEX completed a “ potential” reversal candle but before calling 15745
as a rock solid bottom we must wait for the follow up bull candle next week.
We are not trying to catch a BOTTOM but as we
have identified certain TECHNICAL evidences we believe that if certain levels
are crossed we can have a significant up side from these levels also NOTE that
an IDEAL up move will come after SENSEX and NIFTY completes atleast one higher
top and higher bottom formation on daily charts so look for this to happen in
coming days.
Although as on daily chart if by Monday or
Tuesday NIFTY closes above 4924 and if SENSEX closes above 16404 we will have a
good confirmation to enter long.
A weekly close above 5034 and above 16756 for
NIFTY and SENSEX respectively will give a more solid confirmation that we have
a good bottom in place.
We will track different indicators during the
next week to identify strength if a bottom is actually in place but this BANK
NIFTY chart suggests that atleast BANKING STOCKS may have hit one significant
bottom.
CNX BANK INDEX
WEEKLY CHART :
We projected the target of 8500 around during
last week CNX BANK INDEX made a low of 8625 and bounced back.
TECHNICALLY we need to see and confirm that a
HIGHER BOTTOM & HIGHER TOP is in place for SENSEX and NIFTY to call it a
bottom but we did suggested a few weeks back that there can be a significant
bottom in our markets around NIFTY level of 4538-4625 and SENSEX level of 14900-15300
but BANK NIFTY completed its projected target and in the mean time NIFTY and
SENSEX just did not breach their august lows.
We also clearly mentioned that there will be
some sort of price pattern I place and now NIFTY AND SENSEX can have a “ DOUBLE
BOTTOM “ also if NEXT WEEK remains bullish SENSEX AND NIFTY may form a “ DOUBLE
CANDLE REVERSAL “ patterns on weekly charts which was also discussed.
Also “POSITIVE DIVERGANCE “ was one TECHNICAL
concept which we discussed earlier and here are few examples of A STRONG
positive divergence inplace.
NEXT WEEK remains an important week to watch
for confirmation of a significant bottom in place for our markets.
4720 and 15765 remains the TREND DECIDER levels
for NIFTY and SENSEX as far as further down side possibilities are concerned
and we will confirm any weakness at higher levels when ever it happens.


No comments:
Post a Comment